Real-time construction project dashboards
Monitor and track anything happening on your projects easily and accurately from project dashboards which give you real-time and reliable data, every time.

Join the companies building better dashboards right now

Using excel and fragmented tools to track and display your project dashboards is resulting in missing and delayed data, which is impacting your ability to make good decisions.
Start getting real-time information from the field which is standardised for better data collection
Dashpivot project dashboards 'pull' data from the forms being filled out in the field automatically.
When one of your engineers or foreman fills out a site diary or safety checklist, that form information is sent into Dashpivot in real-time. This means all of the data in your dashboards and charts is always accurate and always up-to-date.

Create organised project dashboards and custom charts for all of your teams and functions. Stay on top of everything happening on your projects without doing any manual data entry or complex dashboard building.

Easy-to-use and organised dashboards
Create custom dashboards for safety, quality, environmental, commercial, production, labour and more.
Maintain all of your data and analytics from one consolidated platform where everyone can work together and see the same thing.
Accurate real-time data means you can make good real-time decisions.

Dashpivot analytics are extremely valuable to our business.
Adrian G.
Construction Manager
Setup your construction project dashboards once, and then let software handle the rest
Once your charts are setup in Dashpivot, they automatically continue to pull and display the data being captured today, tomorrow and the next day.
This means you don't have to back and enter data from last weeks forms. All of the data capture and aggregation is done for you.

See how easily you can setup your construction project dashboards now.
All of your key performance indicators (KPI's), in one smart construction project KPI dashboard organised however you want.

Unlimited flexibility means unlimited insights and controls over what you display and share in your dashboards
Dashpivot allows you to display table data from any of your forms.
- See how many safety incidents have occured
- Track the number of defects and which subcontractors are responsible for what
- Track the daily production quantities of paving, concrete or excavations
Dashpivot is flexible enough to handle any and all of your project dashboard needs.
Dive and pivot into the details to get previously impossible insights about your construction projects and performance.
Dashpivot gives you unprecedented control over how you display your information and what you can find out.
Easily filter incidents or defects by specific subcontractors, or see the hours worked by a specific team.
These insights and the ease of which you can get them helps you better understand performance and make better decisions about how to improve.

Dashpivot also stores and houses all of your project evidence and proof of work to supplement your dashboards. Dashpivot is the place where all of your work happens - and where work is connected.
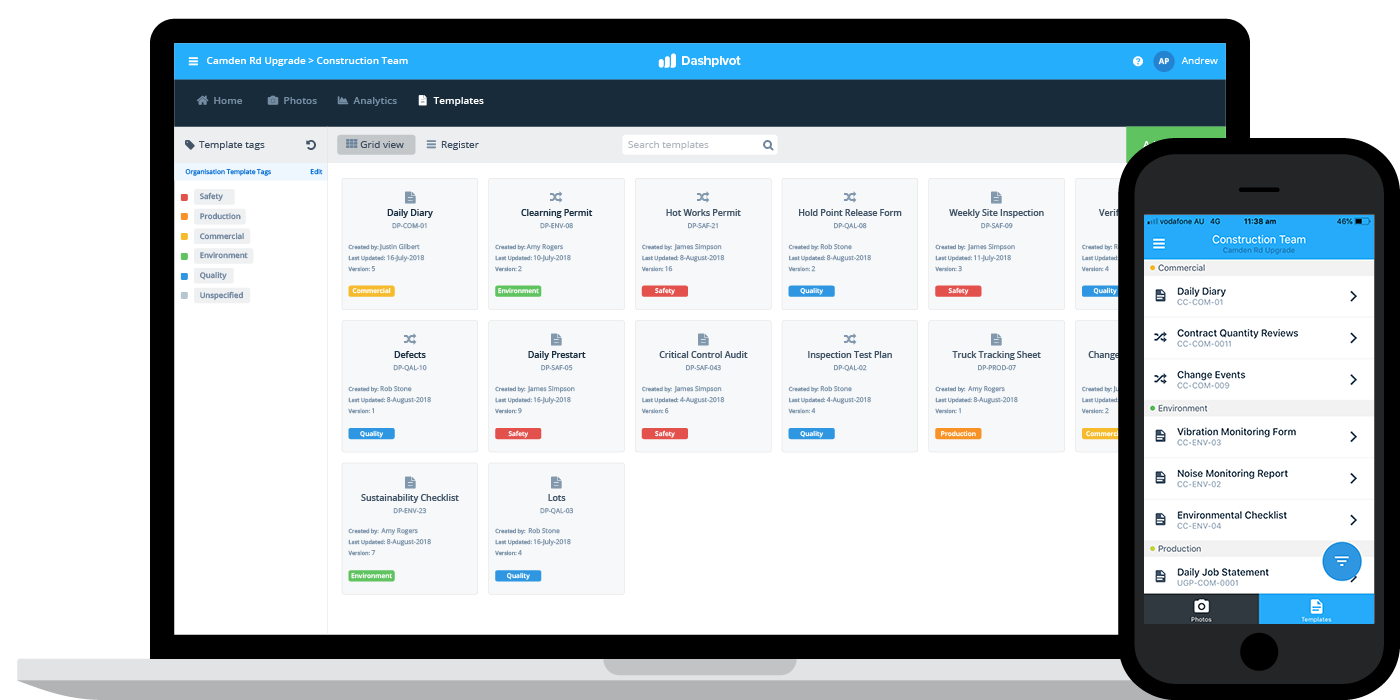
A library of smart templates and digital forms which standardise and streamline construction site information capture.
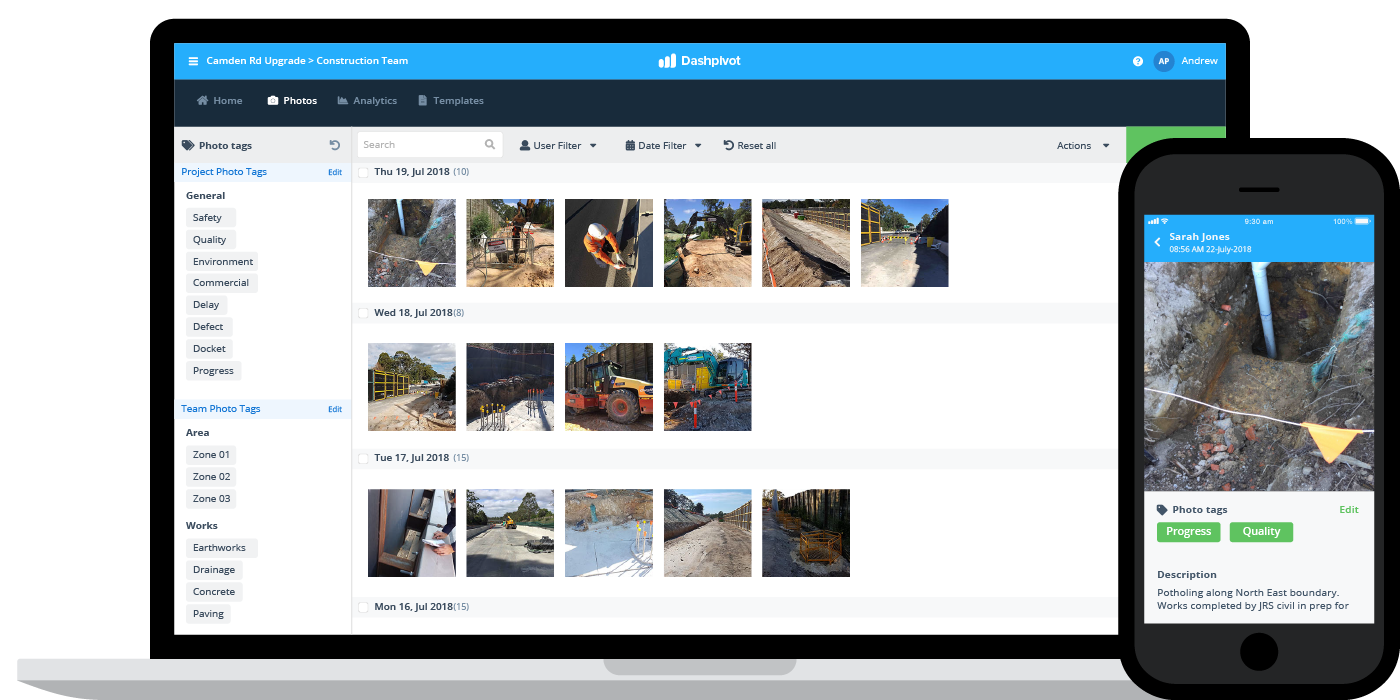
A cloud-based library for photos and videos captured with the Dashpivot app to paint a full picture of project progress and ensure bulletproof records.
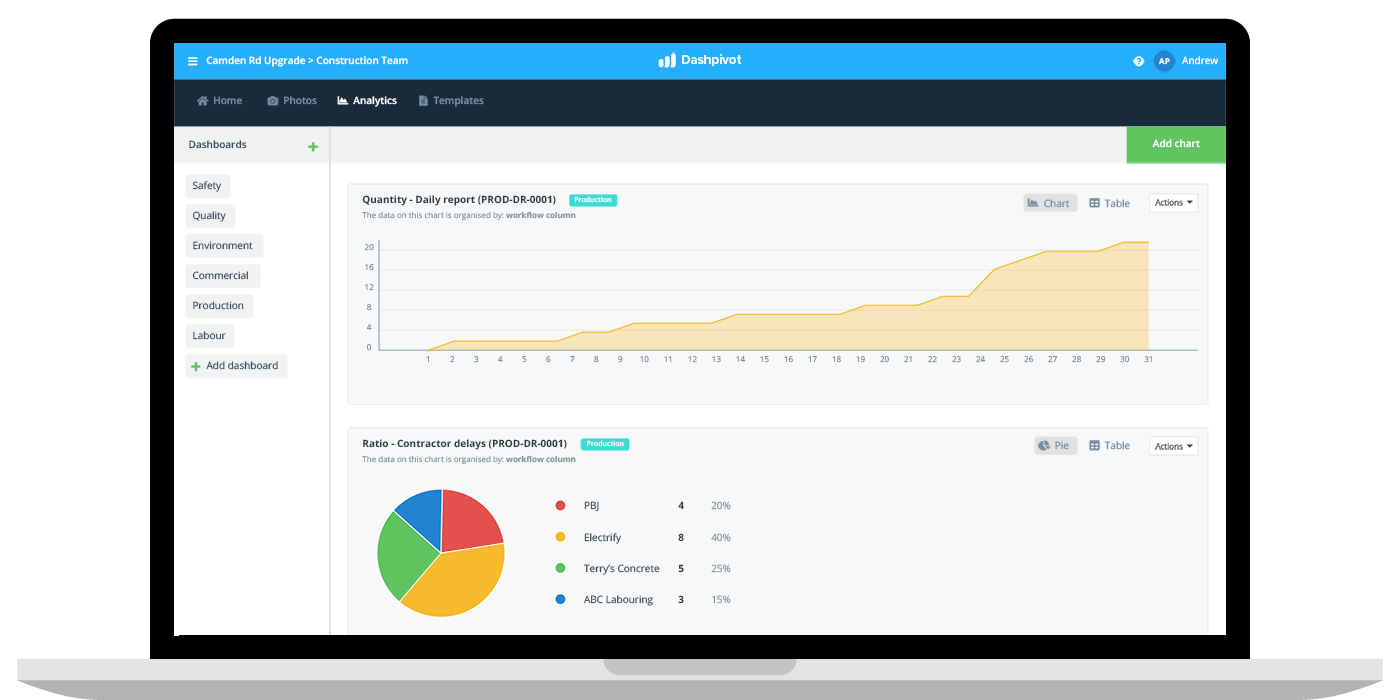
Analytics dashboards which are tightly connected to your forms and photos to better understand and prove what's happening every step of the project journey.
And if you need to get something out of the cloud?
Instantly print, share or download any of the information or data stored in Dashpivot in perfectly formatted PDF or excel documents which have your custom branding and logo included.

People in 70+ countries use this construction project management software to deliver on time and on budget.
