Safety – Key performance indicators for health safety and environment
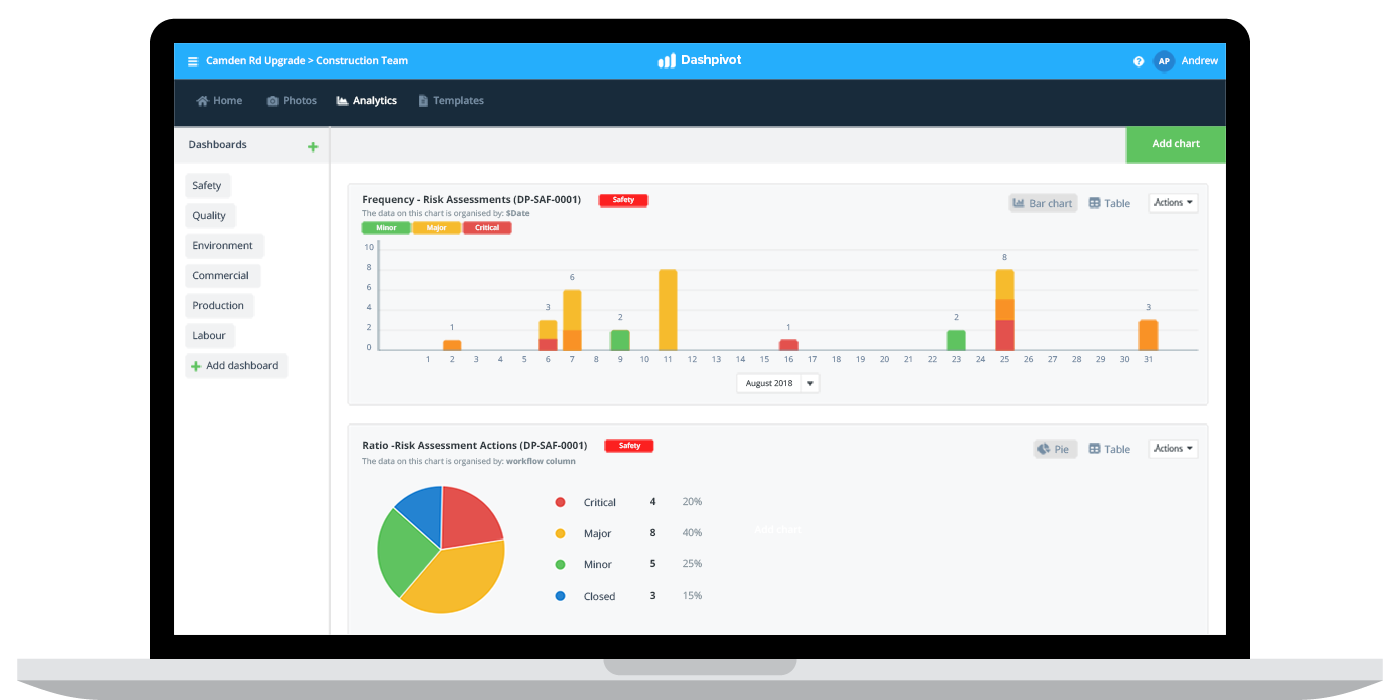
Key performance indicators for health safety and environment
What are key performance indicators and why do they matter?
Key performance indicators are the 'indicators' which people and companies use to measure performance and progress towards certain goals.
Key performance indicators or 'KPI's' have become increasingly popular in recent years as measuring these indicators with smarter tools and softwares has become easier and far more accurate.
There are two main types of indicators to be aware of and cognisant of when making decisions about the KPI's you set and track:
Lagging indicators are indicators which provide an overview of past performance, such as the number of injuries or incidents which occurred in the last 6 months.
Leading indicators are the indicators which are indicative of future performance in that area of measurement - such as the number of safety training sessions or inspections - which would be expected to reduce incidents in the future.
Both of these 'categories' are important, and a strong combination of both is the best recipe for success.
I'm sure you have probably heard why key performance indicators for health safety and environment are crucial before, but it cannot be mentioned enough.
The main point and benefit of using key performance indicators across health safety and environment is that it enables a worker, project or company to measure performance.
Without KPI's and objective measures:
- You don't know how you are performing
- You don't know how to improve your performance
- You don't know whether the changes you are implementing are making a difference
This is especially true in function like health safety and environment, where it's not obvious through project outcomes and financial performance how well things are going.
Now that we have introduced key performance indicators, we are going to take a look at some of the most important ones you should be measuring.
This article specifically will be focusing on key performance indicators for health safety and environment across the heavy industries such as construction, oil and gas, manufacturing and mining.
Other variables which will dictate which KPI's you choose include where your organisation is today in terms of health safety and environmental performance, how sophisticated your methods of tracking and understanding your KPI's are and how ambitious your organisation is about improving these metrics over a period of time.
The 'key' key performance indicators for health and safety
Health and safety have become increasingly important functions for all companies, as the expectations for people getting home safely from work increases, as well as the scrutiny on companies who are negligent.
One of the more recent trends across health and safety has been the increased onus on 'health' as well as safety. More than ever, companies are becoming responsible for ensuring that their workers are healthy, and provided with the tools and environment they need to maintain that health.
Some of the most common and relevant key performance indicators for health and safety today include:
Number of reported accidents and incidents
This is usually the first safety key performance indicator thrown on the safety dashboard, and it's obvious why.
If accidents and incident are increasing in the workplace or on site, then there are some urgent issues which need addressing. If certain projects or sites are experiencing a higher rate of incidents, then that site should be investigated.
Accidents and incidents are easy to spot and document, and make for a big and important KPI.
The actual measure of performance here is at the very least the number of accidents or incidents. But this number is usually converted into a standard ration of 'X accidents per employee'.
This way, a company or project can easily measure itself against other project and benchmarks - no matter the size of the project or operation.
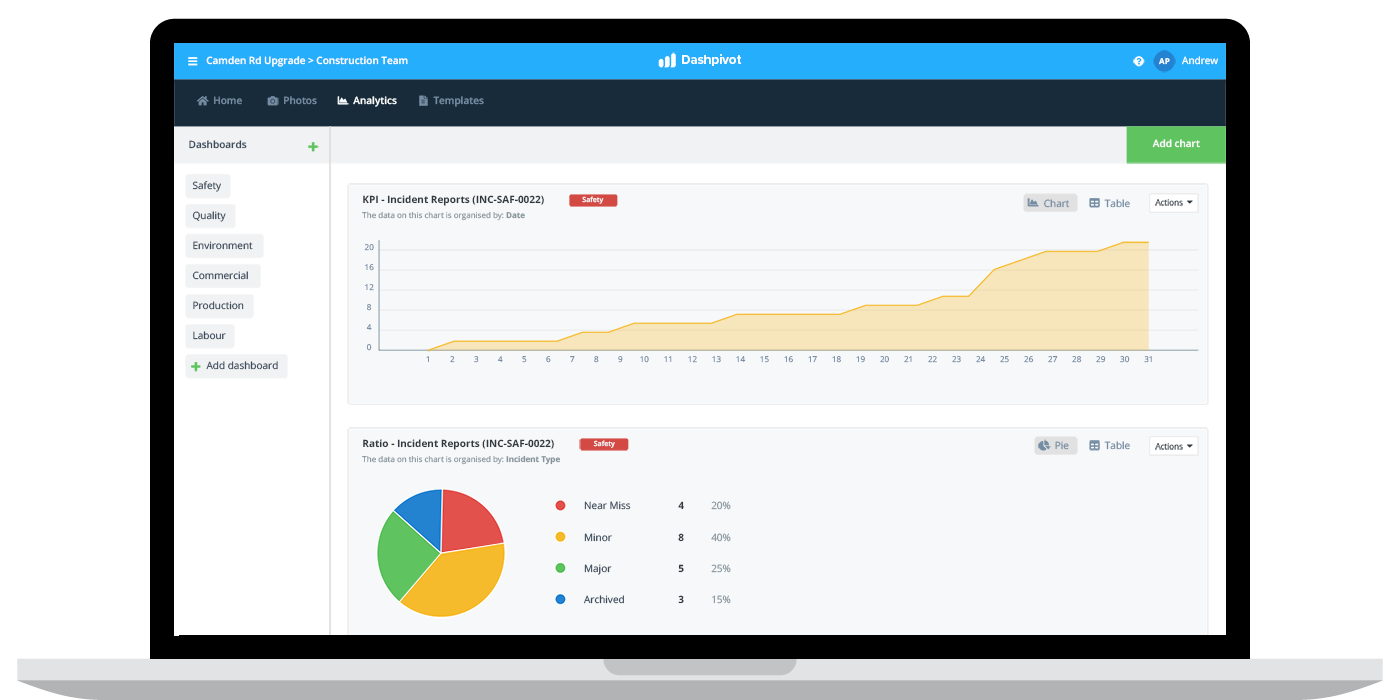
Lost time injury frequency rate and lost time injury incidence rate
There are a couple of major downsides for companies and projects when it comes to poor health and safety performance.
The first of course that there are humans behind the organisation who care about the wellbeing of their employees and friends.
But there are also financial and operational incentives for keeping people safe. When a person or people get injured - they are out of work. This can cost the company money in the form of damages, but can quickly impact the company or project in terms of productivity.
The key performance indicators which bring these different incentives together are the lost time injury frequency and lost time injury incidence rate.
Lost time injury frequency rate or 'LTIFR' refers to the number of lost time injuries which occur per million hours worked (learn more about calculating this safety KPI here).
Lost time injury incidence rate or 'LTIIR' measures the incident events which occur over a standard period of time by a standard number of people (learn more about calculating this safety KPI here).
These health and safety key performance indicators (similarly to incident rate above) can be easily benchmarked against other companies, industries and of course other projects of your own so that you can quickly understand how you are doing.
Equipment breakdowns
Equipment breakdowns are both an important production and equipment management issues, as well as a key performance indicator for safety.
Many of the health and safety hazards and issues which occur on industrial sites happen because of equipment failures.
Understanding how many equipment breakdowns you are having is a good indicator of how many accidents will occur on your sites - especially when you have a strong reference number for the ratio of incidents which occur due to equipment breakdowns.
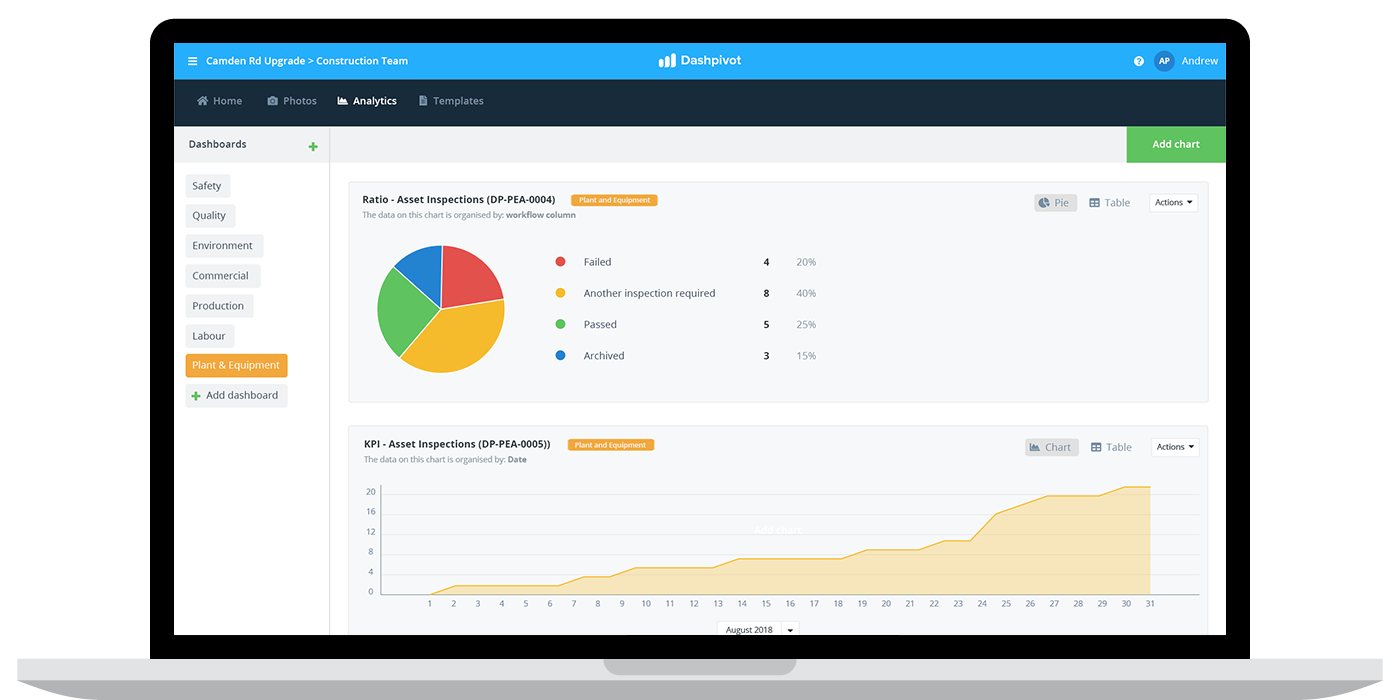
If this key performance indicator is showing concern, there are some obvious solutions like increasing the number of plant and equipment inspections, and looking at the type of equipment being used for the job.
Employee satisfaction with management commitment and average overtime hours per person
As was mentioned previously, the personal health of workers is starting to fall within the jurisdiction of companies more and more. Two key performance indicators which are being used more and more and which showcase this trend are worker perception of management commitment and average overtime hours per person.
Employee satisfaction with managements' commitment to health and safety is a bit 'softer' than some of the other key performance indicators here, but it's critically important.
A high management satisfaction rate shows that employees feel like they are cared about, which improves their participation and commitment to health and safety and results in more productive workers.
Measuring this KPI is usually done with simple surveys for quantative feedback, which can be bolstered with some qualittative feedback as well.
While the average overtime hours per person is quick and easy KPI which can be measured and analysed to identify whether or not people are being overworked and how well resourced the project or company is.
The 'key' key performance indicators for environment
Like the health and safety key performance indicators above, environmental KPI's have also become an increasingly important measure of performance for projects and companies.
The environment is and will continue to be a more important factor for projects and for all stakeholders.
So what are the main environmental key performance indicators which are being included in a companies overall health safety and environmental performance indicators?
Amount of energy saved from conservation and efficiency optimisations
One of the big pushes in workplaces all over the world in recent years has been around energy savings. Some of these energy savings have come from improvements in technology and equipment, while others have stemmed from behavioural changes and smarter more conscious decision making.
Companies can typically see their energy use and energy costs quite easily, so monitoring usage levels after making certain changes should illustrate progress against the previous usage or benchmark.
Simple decisions around turning off office lights or using smarter equipment which turn things off when they are dormant can quickly improve outcomes in this area.
Total energy used per unit of production
Total energy used per unit of production is somewhat similar to the above key performance indicator, but is more based around the efficiency of outputs stemming from the energy inputs.
Amount of energy saved is a good KPI, but it's even better to know if you are getting more output from a production perspective from less energy inputs. If you are, then you are building a more efficient operation and will make more money.
Companies can eek efficiency improvements in this area out of better plant and equipment, better communication tools and again - smarter decision making.
Noise and vibration levels
There are a number of important site level key performance indicators which are important on an environmental and stakeholder level.
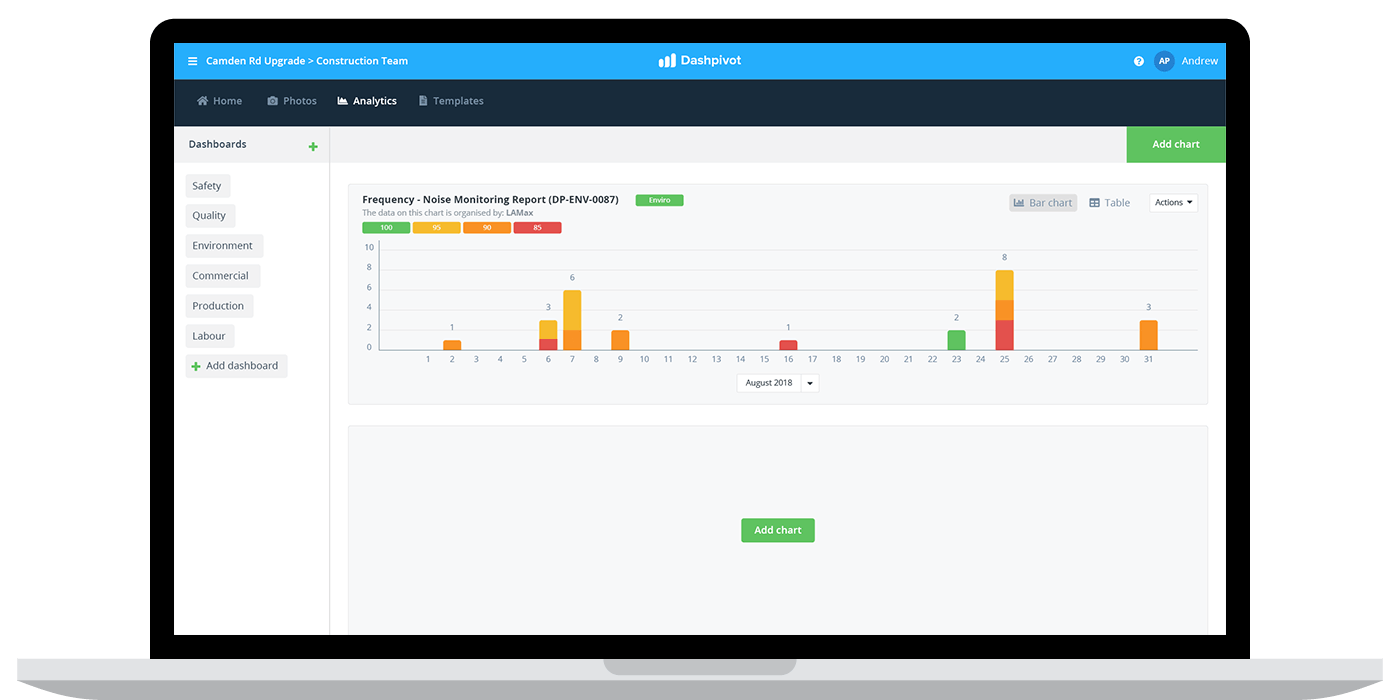
Measuring noise and vibration levels on industrial sites through noise and vibration monitoring equipment is pretty standard on most construction and industrial sites, and keeping these levels at or below acceptable levels is an important project imperative.
Measuring these levels on specific sites and projects and comparing them across each other makes this KPI actionable and usable in the case of disputes or public issues.
Number of paper pages used per employee per month
One of the biggest improvements in environmental management in recent years has been a reduction in the amount of paperwork - thanks mostly to the introduction of project management softwares and apps.
Many companies have been able to measure the reduction in paperwork facilitated by these changes.
But there is still work to do, and many cross-company and project level communications still take place through physical sheets and documents - so a reduction on the amount of paper used per employee will continue to be an important key performance indicator for health safety and environmental .
Percentage of recycled hazardous and non hazardous waste
Waste management is one of the largest environmental categories. How companies manage waste can have a dramatic impact on the environment; and when this is scaled across mega projects, the impacts are huge.
Recycling is a key performance indicator for waste management, and understanding the percentage of recycled hazardous and non hazardous waste is a key element of this.
Tracking recycling rates and waste production over time is really important for modern industrial companies, and will continue to be a key KPI in the years to come.
How to best track and measure your KPI's across health safety and environment
It's all good and well talking about key performance indicators for health safety and environment, and lecturing people about their importance - but how can companies most effectively measure and act on this KPI's?
In the past, companies would need an army of administrators to reconcile all of the paperwork and information being captured on site. Workers would have to be extremely diligent about documenting everything on paper, scanning those records and then sending them to the systems teams tracking everything and building KPI dashboards.
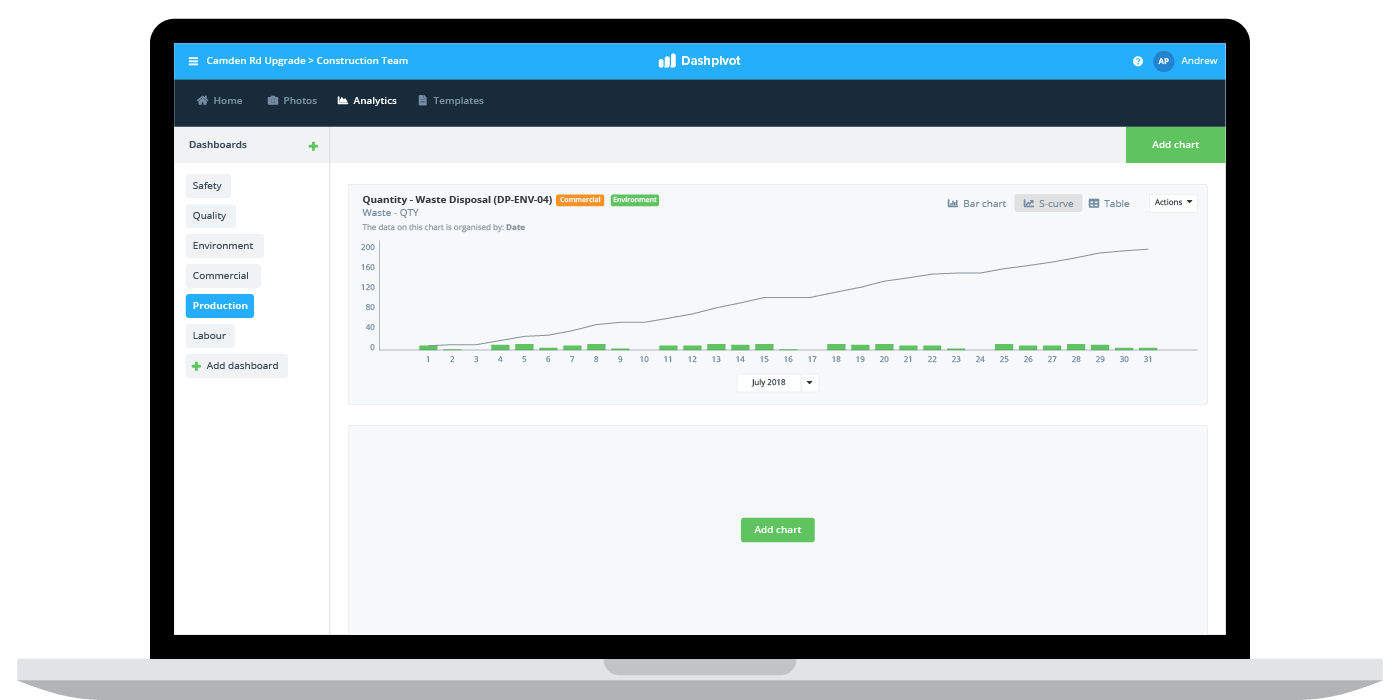
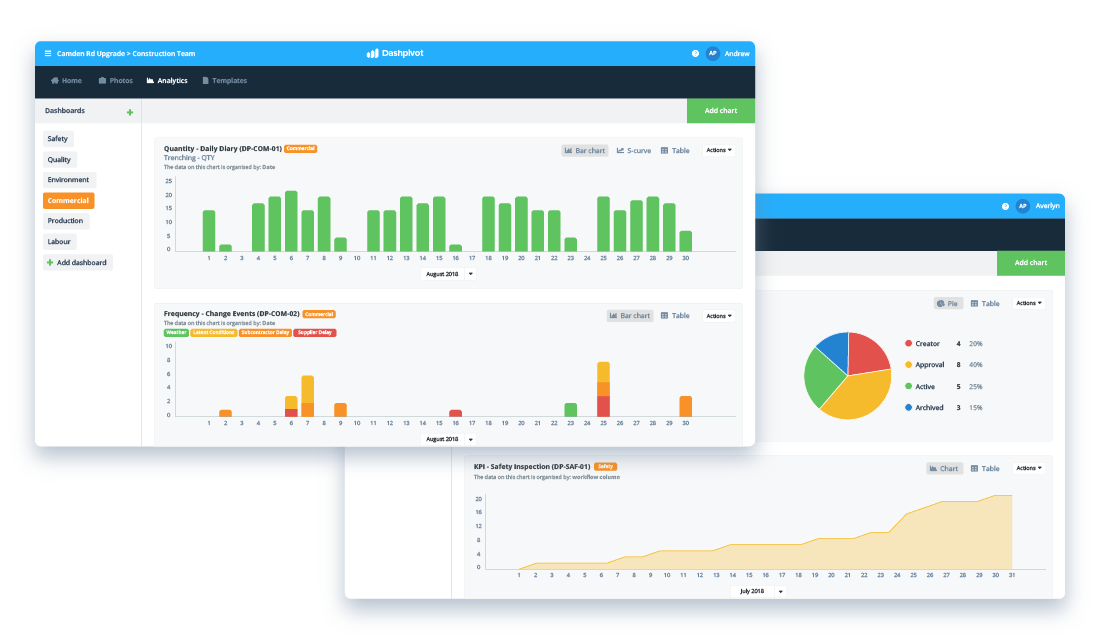
Today, almost all of this work can be offloaded to softwares and digital dashboards, which automatically aggregate the information being collected on site and display it in real-time KPI dashboards.
You can see some great examples of these smart dashboards dotted throughout this article, with dashboards which span the entire health safety and environmental spectrum.
Once a company has defined what their key performance indicators are for health safety and environment, and then built out the structure of their dashboards, the rest is taken care of.
Instead of spending countless hours and resources on simply measuring the KPI's, companies and workers can spend more of their time on diving into the data and making more informed decisions about how to improve these key performance indicators and create better health safety and environmental outcomes.
Use this software to improve and better measure your key performance indicators.
People in 80+ countries use this safety management system to set, organise and track their key performance indicators in real-time.

this very good anylsis for KPIS .iam very intrest by this subjects
Can you send more information.iam in petrolium company