Project directors suppressed by gantt charts want construction project dashboards

Project directors suppressed by Gantt Charts want Construction Project Dashboards.
98% of mega projects face cost overruns or delays (source: McKinsey & Company).
So who’s in the 2%?
Toyota?
No, they only build the cars that drive on the infrastructure.
Tesla?
Nope. But I believe Elon might be soon with his new tunnelling gig.

The 2% are probably just the lucky ones at the moment.
I don’t personally know the people who completed the research that revealed this particular statistic. But it is safe to say that coming from McKinsey one can assume it wasn’t published lightly.
Even if (god forbid) something did go wrong with the research and it is say, 50% off, that’s still 1 in 2 mega projects…
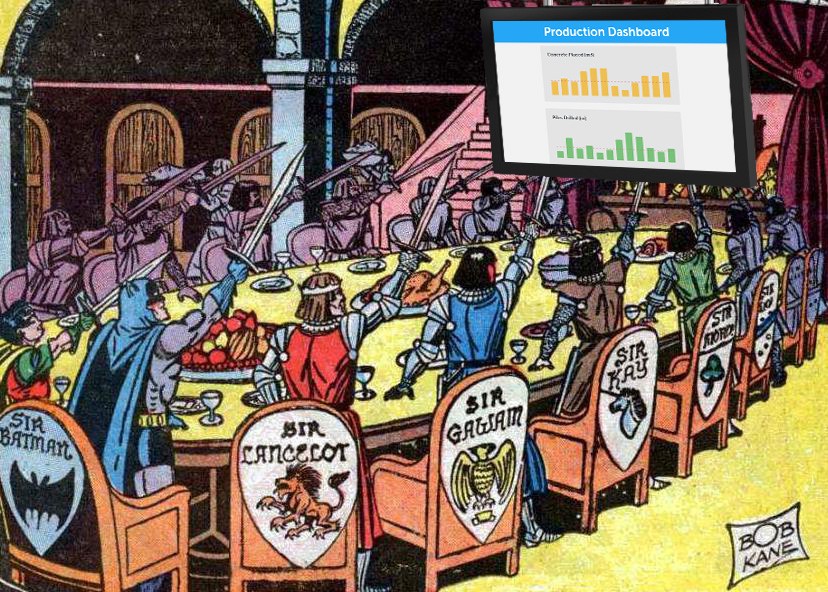
With a statistic like that — there are no sacred cows, no limits to exploration, and no questions that cannot be asked.
Disclaimer: this article is not suggesting gantt charts are not currently, and will not be in future, required on construction projects. The point of this article is to argue that the time spent by key project individuals reviewing lagging indicators VS. analysing and comprehending production metrics is severely imbalanced.
Let’s Explore Paralysis by Parkinson’s Law:
Construction work expands so as to fill the time allocated for it’s completion, which is derived from program milestones.

This story starts by asking the following question;
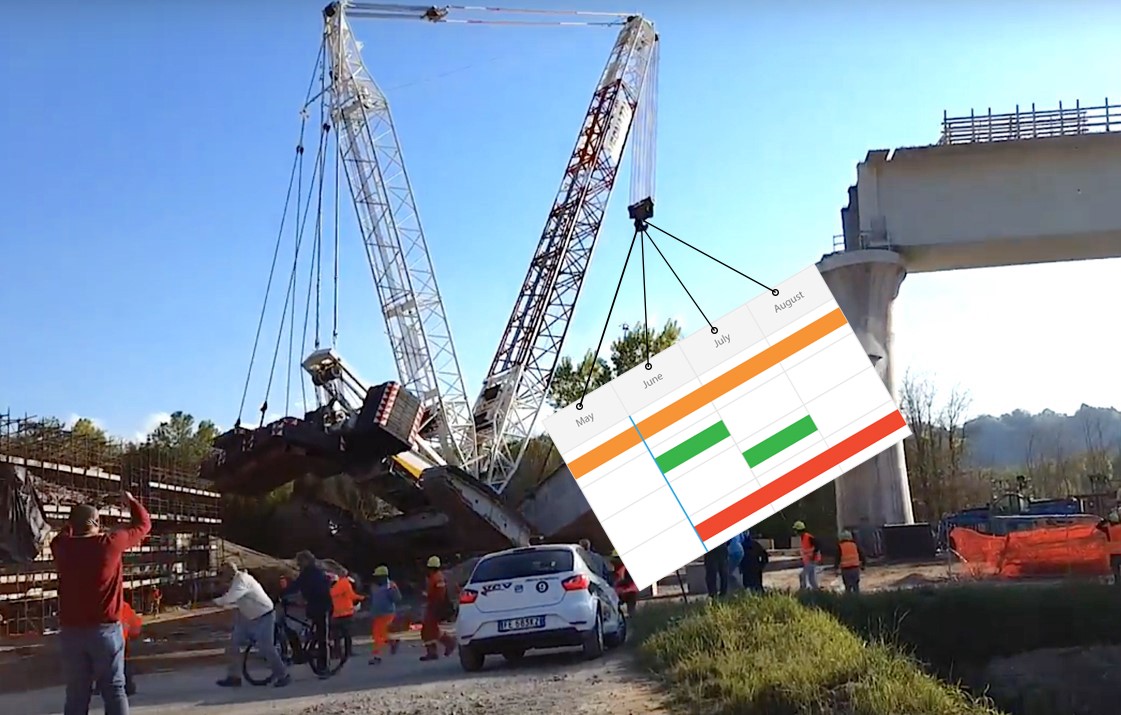
How much value can be derived from reviewing gantt charts retrospectively in an attempt to predict future performance?
Reviewing Gantt charts as a primary tool in the construction project controls belt only reveals lagging indicators.
Take a scenario where during a weekly program review meeting in the site office, a line item on the Gantt chart for piling works is recorded as being 80% complete, when it ‘should’ have been 100% complete last Wednesday.
The Project Manager’s left eyebrow twitches a little when he finds out… he looks mad.
Then an engineer starts a narrative explanation.
The only thing rising is the tension.
It becomes subjective.
But hold on a minute, what was actually possible with the piling rig?
Was the scheduled 100% completion date of last Wednesday just impossible?
Is 80% complete actually performing well?
Most of the time no one actually knows, and again, it’s all just very subjective.
When things don’t go to plan, retrospective program reviews increase interpersonal tension and issues compound.
It is time to move past reactive project steering.
A constant sense of urgency to focus on what is truly meaningful can be achieved through construction project dashboard analytics.
Dan Cable, in his book Change to Strange, describes how ‘lagging indicators are essential, but not very proactive.’
‘Bless your heart if this is all you measure to lead your organisation.’
What’s missing during project delivery are the windshield indicators. The indicators that could be revealing things immediately before they hit you, like when bugs are splattering on the front of your car driving down a dirt road.
Windshield indicators allow you to see things that don’t align to your project’s strategy, and allow you to fix it before too many bugs pile up on your lights and you can’t see.
And then you hit a tree.
In my last article (see BIM Has Reached The Final Frontier, And Is Losing The Battle), John Darmody, former Managing Director of the Australian arm of the global MWH conglomerate, provided insight from his many years of experience in the industry.

‘When you consider where the tools for controlling construction have their roots, it’s limited to scheduling and CAD drawing.
Both of these are top down concepts with no or poor feedback for improving what happens with day to day construction.
No way to measure and increase productivity, or interrogate sub tasks to optimize site activity.’
To drive your critical path with informed decisions, collect data.

Life Before Construction Project Dashboard Analytics
Imagine you are a Project Director for a moment, or maybe you already are, days are spent crawling through hundreds of emails containing sporadic updates, receiving phone calls when things go wrong and having hallway conversations hearing the filtered truth.
Thinking about your immediate next most important action as a leader feels murky.

Life After Construction Project Dashboard Analytics
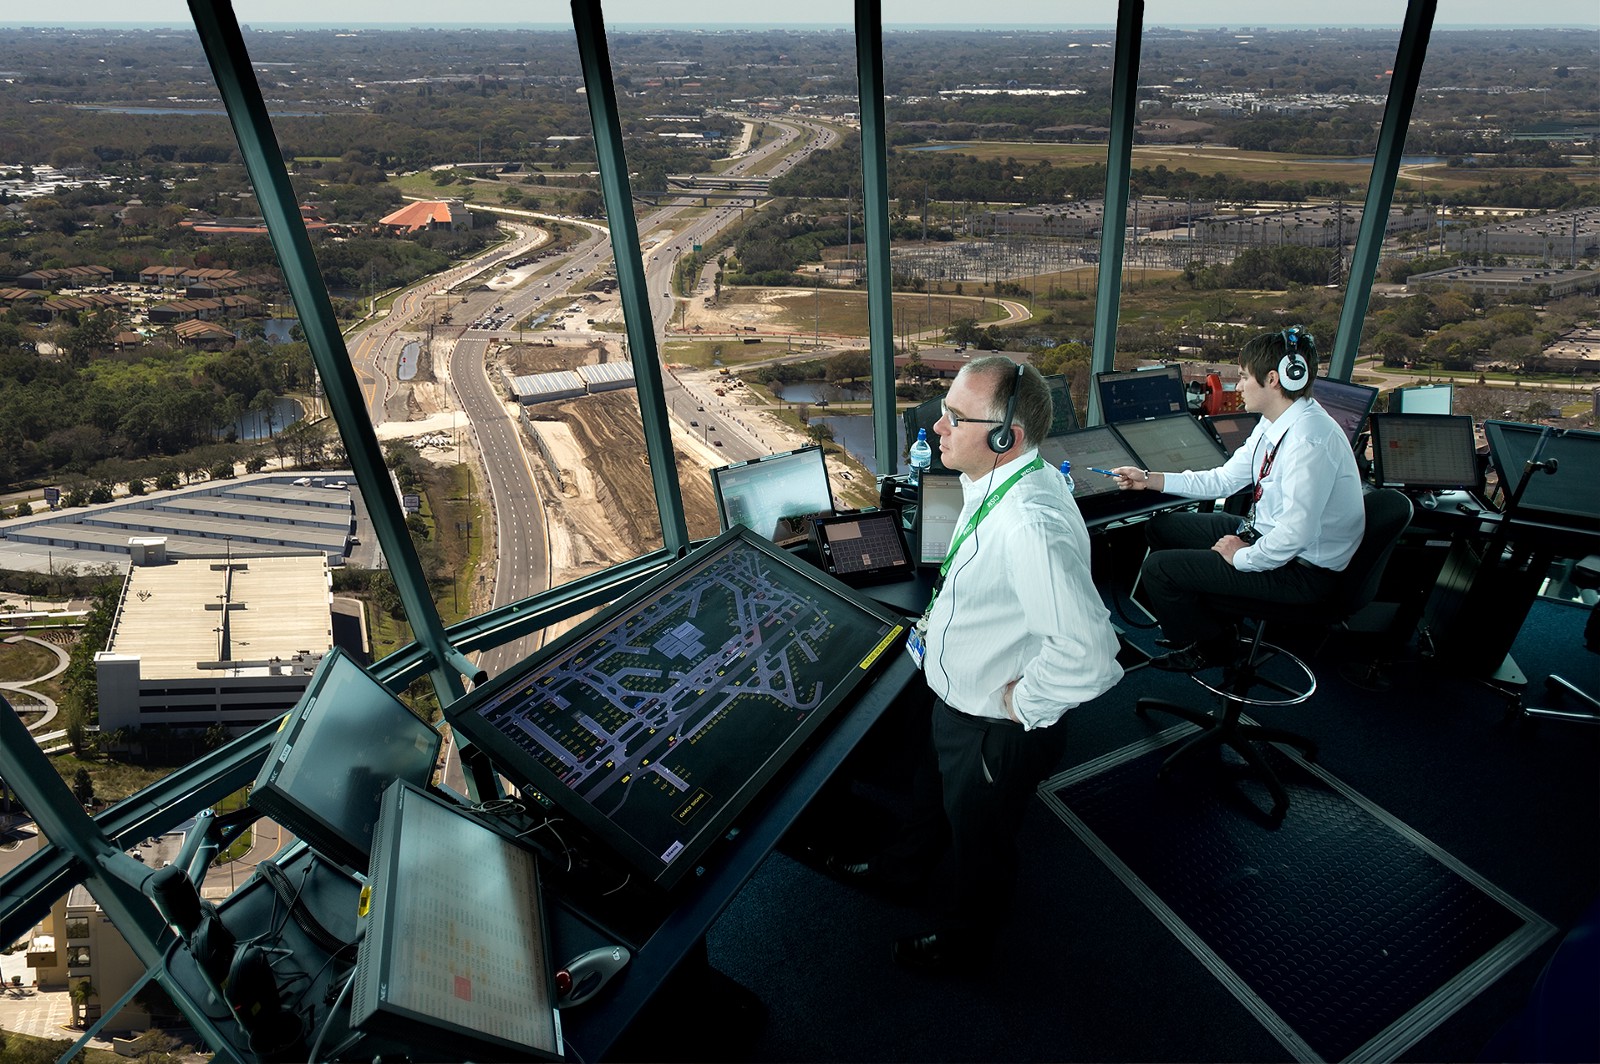
Now think about sitting in your mega project’s control tower, where you can see how virtually everything is actually performing using unit measurements against programmed time allocation.
Looking at numbers means that you stumble upon issues, that were previously hidden.
Finding an issue is the first step towards being in a position to overcome it.
Numbers provide actionable insights that unite your team.
They either go up, or they go down.
Thinking about your immediate next most important as a leader is now crystal clear.
Fix the numbers.

Consider Optimal Flow
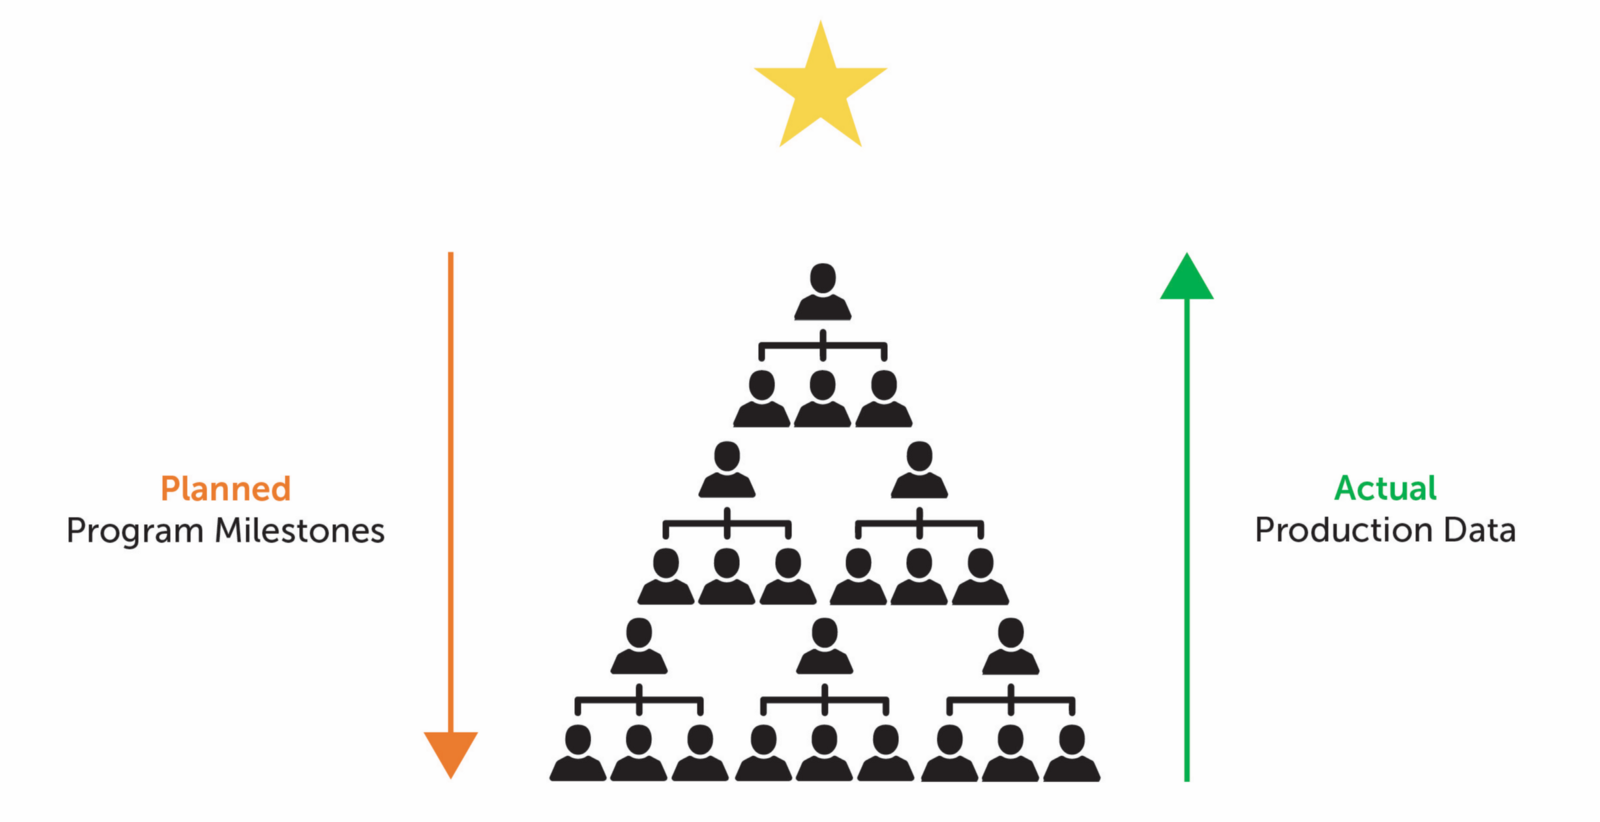
When changing focus from reactive to proactive project steering, the ultimate goal of commencing operations at your project’s Practical Completion acts as a guiding star.
Program milestones are communicated down the lines.
Production data is captured, and analytics reveal actual output vs. planned.
It is important to note that the production data can’t simply be bulk measurements over time, but should be unit measurements reflecting multiple factors. These factors might include work that was available to be completed, resources, plant/equipment downtime and environmental/ground conditions.
As a Project Director, you and your team can then explore whether or not actual output can be increased safely, or if initial milestones were or weren’t realistic.
The conversation has started, and it is anchored objectively on the truth.
Informed adjustments can be made and measured accurately.
You are now holding your mega project ship’s wheel.

Or you might be ahead of the game, and are now thinking thanks for telling me something I already knew, of course everyone would want this data!
Some projects, particularly larger teams, are already on the mission of collecting and processing this data.
However even for those that have started, the process usually requires a humungous effort, at least, it did when I was involved. Mass amounts of information have to be collected by hand, transferred physically between multiple people in written form, and then emailed, and then processed in excel.
And then transferred to a central controls engineer, reprocessed, printed out, looked at.
And probably some other steps that I missed.

Q; It takes a really long time to collect this data. And no one wants to do it. They tell me they are already busy enough. What are we meant to do?
They are busy enough, start saving them some time by removing quadruple handling and archaic processing of information. Then they will actually want to do it.
Q; But we already collect production quantities and collate them in our end of month reports — isn’t that our data?
Monthly quantities don’t reveal the performance of unit measurements, only total cost per code. This information is crucial from a financial perspective, but provides limited actionable insight from a production perspective.
Plus, a monthly pulse for production data reviews will slowly kill a project.
Get Construction Key Performance Indicators Analytics in 3 Steps
It’s mostly likely that the information you need is already being captured by someone, somewhere, in some form, and that all you need to do now is bring it together.
You cannot improve what you do not measure, and production data can’t be measured when it lives across multiple sources.
If you’re not collecting key production data at all, here’s some tips to help you start.
If you have already started, these should also help streamline capture and processing.
Standardise — remove the five (5) different types of site diaries that are being completed across your job — whether it’s Word, Excel, hand written, or nothing at all. Without standardisation, you don’t know what you do today, and you can’t improve it tomorrow.
Incentivise — ask your team what annoys them, and then remove it. If people have headaches then it is not adding value at the level of the individual. Think about how you can help them shine as an individual contributor when collecting data.
Formalise — as long as it is anchored to objective data, make discussions about performance part of your culture. Include a dot point in the agenda of your weekly meeting, even if it’s just 10 minutes. Daily pulse is optimal, bi-weekly is a good, weekly is a start.

And how do I know that Project Directors want construction dashboard analytics?
I either asked, or I listened.
Key Takeaway: we must move the entire industry’s reporting culture towards a dashboard mentality with very little narrative. Information must be instantly recognisable and digestible. Information systems need to show more people, more often, data that provides honest and unvarnished news. We will end up with a robust history and story of how every project performed in key areas.