Safety – Safety KPIs

Safety KPIs and how to calculate them
Which safety KPI's are you looking for?
The pressure on companies to create healthy and safe working environments is constantly increasing. Part of this pressure comes from external stakeholders, parties and authorities, while the other portion stems from internal workers and teams.
These pressures (from all angles) have manifested themselves in a deeper need and desire for tracking safety performance through the trusted safety KPI.
There are a number of safety KPI's which help workers, safety teams and companies to gauge their safety importance, track it over time, and ultimately make better decisions about how to improve it.
The table below summarises some of these key safety KPI's.
The table is broken down into 4 columns:
- KPI acronym - You will often see or hear safety KPI's referred to in acronym form, because it is quicker and easier.
- KPI name - The above acronym expanded into its full english form.
- KPI meaning - A one or two sentence description of what this safety KPI is used for.
- KPI formula - The formula you can use to calculate this particular KPI at your company or on your projects.
If you are looking for more specific details about a certain key performance indicator, you can click on the KPI name or 'topic' or the formula. Here you will find more information, examples and more detail around the KPI calculation itself.
Otherwise read on to get a good general overview of the safety KPI, how to calculate them, how to track them - and see some examples of safety KPI's in construction and industrial industries.
All of this KPI's are important to every company and every project, so take a moment to make sure you have all of your bases covered.
| Safety KPI Acronym | Safety KPI 'name' | Safety KPI meaning | Safety KPI formula |
|---|---|---|---|
| TCIR | Total case incident rate | The number of work-related injuries per 100 full-time workers during a one year period. | (Number of recordable cases x 200,000) / Employee total hours worked |
| TRIR | Total Recordable Incident Rate | The number of work-related injuries per 100 full-time workers during a one year period. | (Number of recordable injuries and illnesses x 200,000) / Employee total hours worked |
| TRIFR | Total recordable injury frequency rate | The number of fatalities, lost time injuries, cases or substitute work and other injuries requiring medical treatment by a medical professional per million hours worked. | (Recorded fatalities, LTIs, alternate work, and other injuries requiring medical treatment from a professional x 1,000,000) / Employee total hours worked |
| TRCF | Total Recordable Case Frequence | A 12-month rolling average total recordable case frequency per 1 million man hours. Man hours are based on a 12 hour working day or actual hours worked if recorded. | (Number of recordable cases x 1,000,000) / Employee total hours worked |
| AIFR | All Injury Frequency Rate | This is a measure of all reportable injuries - lost time injuries, restricted work injuries and medical treatment cases - per 200,000 hours worked. | (Reportable injuries x 200,000) / Employee total hours worked |
| AFR | Accident frequency rate | The frequency rate is the number of occupational accidents ( work stopped more than one day) arisen during a period of 12 months by one million hours worked | (Number of reportable accidents x 200,000)/ Employee total hours worked |
| MTI Safety | Medical treatment injury | An injury or disease that resulted in a certain level of treatment (not first aid treatment) given by a physician or other medical personnel under standing orders of a physician. | Not applicable |
| LTI safety | Lost time injury | A lost-time injury is something that results in a fatality, permanent disability or time lost from work. It could be as little as one day or shift. | Not applicable |
| LTIF | Lost time injury frequency | Not applicable | Not applicable |
| LTIR | Lost time injury rate | Not applicable | Not applicable |
| LTIFR | Lost Time Injury Frequency Rate | the number of lost time injuries that occurred during the reporting period. Most companies choose to calculate LTIFR per 1 million man hours worked. | ([Number of lost time injuries in the reporting period] x 1,000,000) / (Total hours worked in the reporting period) |
| RIFR | Reportable Injury Frequency Rate | Records the number of incidents requiring medical treatment, divided by the number of hours worked within an accounting period, multiplied by 100,000. | ([Number of incidents requiring medical treatment in the reporting period] x 100,000) / (Total hours worked in the reporting period) |
| DART Safety | Days away, restricted or transferred | A lagging indicator that is used to measure workplace injuries and illnesses that result in time away from work, restricted job roles, or permanent transfers to new positions. | (Number of DART incidents) x 200,000 / (Total number of hours worked) |
| N/A | Severity Rate | Gives a company an average of the number of lost days per recordable incident. | (The actual number of lost work days x 200,000) / total number of hours worked by all employees |
| N/A | Medical treatment case | Any injury sustained on the job by an employee which requires medical treatment from a professional physician or qualified paramedic. It does not include on the job first aid treatment. | Not applicable |
**Some of the calculations above are based on an annual calculation.
Some employers like to calculate monthly or quarterly incident rates as well, and this can easily be done by using incident and hours-worked figures for only the particular month or quarter.
What is a safety KPI?
A safety KPI is a key performance indicator or 'measure' of safety performance. Each individual KPI targets a specific area of importance, which enables the KPI tracker to measure performance in that area objectively against historic and benchmark data.
Safety is one of those functions or areas of a business which are typically harder to measure than financial performance or productivity. But safety KPI's have really helped companies to better measure it, and now industry associations and bodies have some pretty deep data and benchmarks on what good safety performance looks like across specific industries and activities.
In the past, a company may have been able to make an excuse for an individual mistake or mishap, but safety KPI's show average performance and trends over time - which can't be ignored or excused.
Like everything else, safety performance (other than freak accidents, natural disasters etc.) is a product of the processes and procedures behind that function, so bad KPI numbers mean work needs to be done.
The only other part of the safety KPI which needs defining is the difference between lagging and leading indicators.
Lagging indicators measure a company's 'past' performance i.e what has happened. Lagging safety indicators are often the most publicised safety metrics, as they include the headline stats like recorded injuries and incidents.
Leading indicators measure which can indicate future performance; the indicators which are input focused and not results oriented (but which are expected to impact results). Common leading safety indicators include safety training and safety audits.
There's no right or wrong combination of indicators. Measuring and calculating your KPI 'score' on as many dimensions as possible and applicable to you is the best way to get a true understanding of how things are going.
How to calculate your safety KPI's...
As we have mentioned, most safety KPI's were created to be objective and quantitative measures, which means they have actual formulas.
You can see how to calculate specific KPI's above, and you'll also notice a number of similarities in how they are calculated.
In general, the safety KPI's can be bucketed into two categories:
- Frequency rates - which show how many events happened over a given period of time by a standardised number of hours worked
- Incidents rates - which illustrates how many events happened over a given period of time by a standardised number of employees
Because of the similarities between the two, you can actually convert a frequency rate to an incident rate by simply substituting the number of hours worked out of the equation, and replacing it with the number of employees.
For example, if you you were to calculate the frequency rate of lost time injuries (LTI's), you would first find the number of lost time injuries in the reporting period, multiple that by 1,000,000, and then divide that by the total hours worked in the reporting period.
In an actual example, let's say we have 10 LTI's in the past year and we had 2,000,000 total hours worked, our LTIFR would be:
(10 x 1,000,000) / 2,000,000 = 5 lost time injuries for every million hours worked over the past year
The reason for standardised numbers like 1,000,000 and 200,000 in many of the safety KPI calculations is that they create easily understandable and tangible numbers we can benchmark against others. In other words, they create whole numbers people can easily understand. If the number was too small, like 0.0001 LTI's per hour, then the number wouldn't 'mean' much to use and it would be harder to interpret as good or bad.
In terms of how these numbers are actually crunched, you can of course reconcile your numbers and use a calculator, you can use a spreadsheet to track and formulate the numbers, or you can use a dedicated safety management software to do the heavy lifting for you through dashboards and real-time calculations.
Tracking KPI's over time with a KPI dashboard
It's easy to talk about calculating and measuring safety KPI's, but there are some obvious administration and logistics headaches associated with getting the right numbers and information from your sites and projects.
The most difficult way to keep track of these numbers is to 'assemble' them at the end of the year or reporting period after capturing them with paper-based forms, word docs, spreadsheets and PDFs.
This method requires an incredible amount of coordination and manual data entry, and also reduces in a lot of missing and inaccurate information which naturally happens when data isn't moved in real-time.
The easiest way to track these safety KPI's over time is to use a proper safety management system.
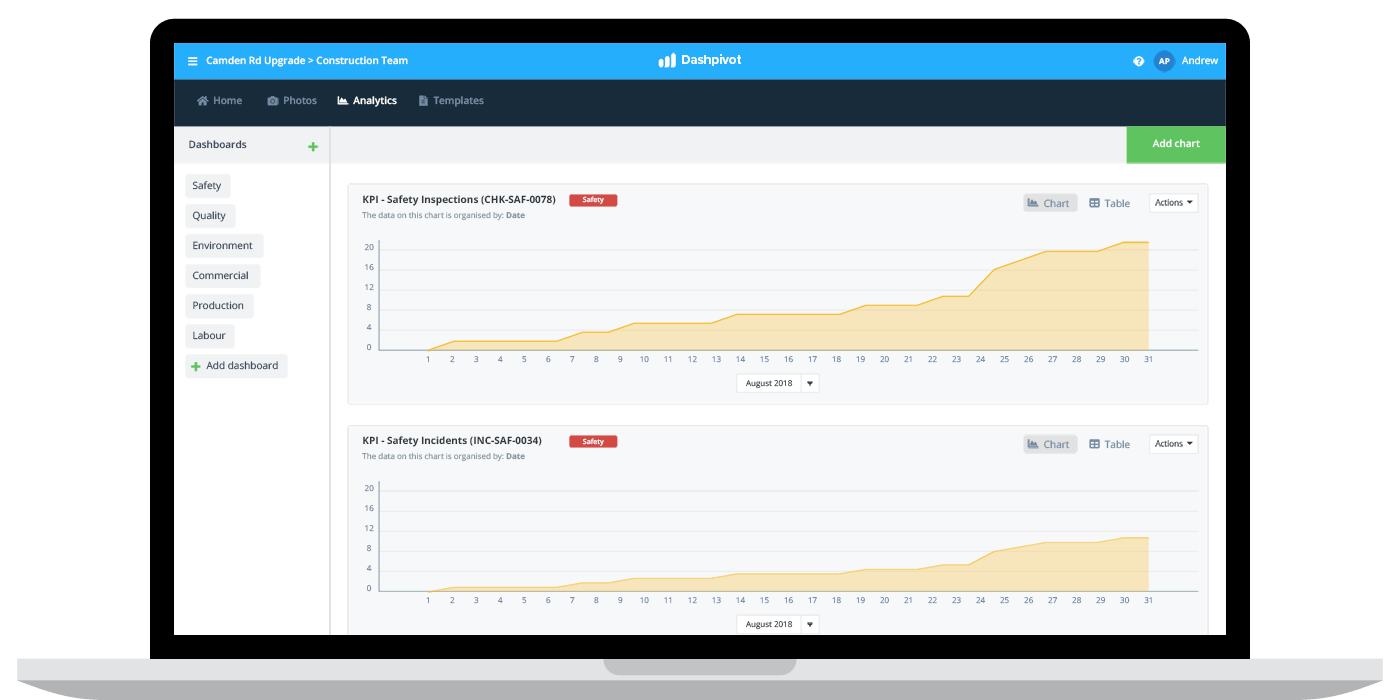
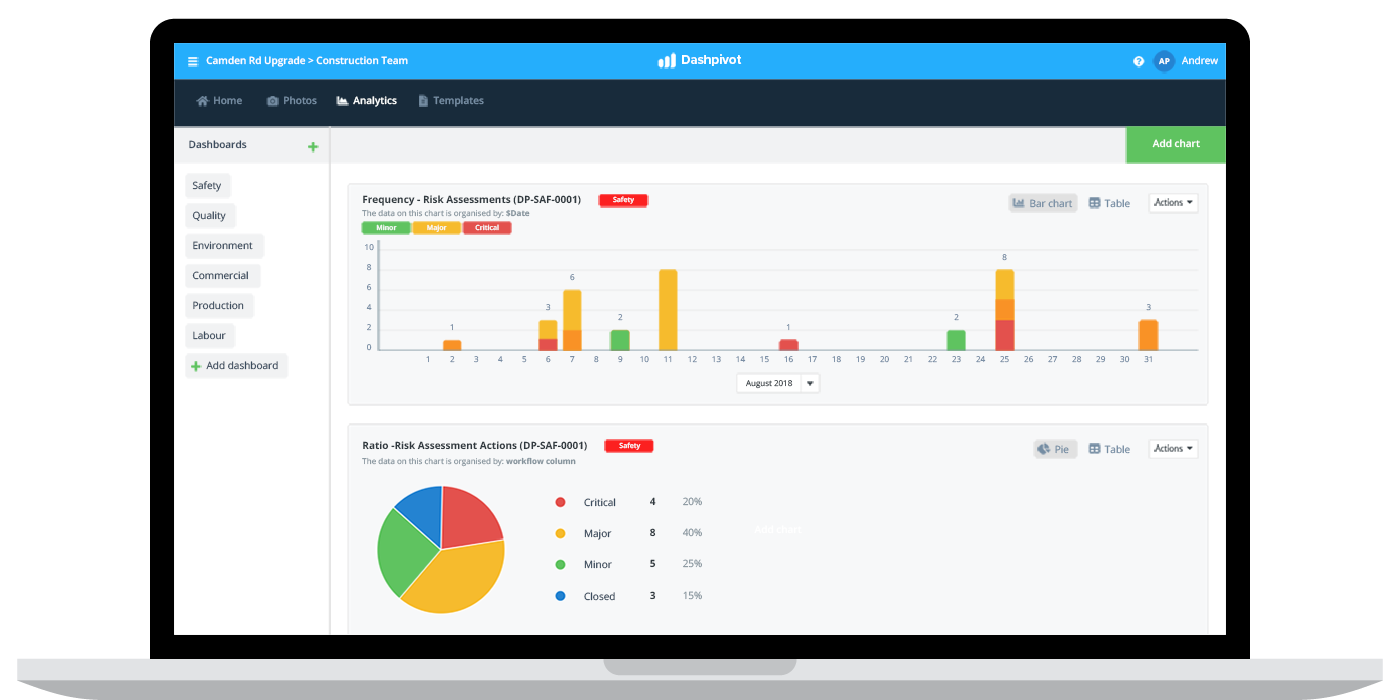
Some of these systems, like the example below, display your safety KPI information in dashboards and automated charts. Unlike the previous manual methods, this data is pulled directly from site in real-time, so the data is always accurate, human error is largely removed, and there is no need to reformat or move data between sources or different document types.
Whatever method you choose, you want to make sure your data is as accurate as possible, because that information will inform your KPI calculations later in the piece - and wrong data means wrong results, and wrong decisions.

Use this system to build and maintain your KPI dashboards.
Safety KPI examples for safety officers and managers
Who is charged with tracking and managing safety KPI's and safety performance at your company will depend mostly on the size of your projects and organisation.
At smaller companies, the director or project manager may be charged with reporting on safety, while at larger companies, dedicated safety officers, safety managers and safety teams spend their time tracking these numbers intently, and then making process and procedural changes to improve them.
An example safety KPI which a safety officer is going to really care about is the number of risk assessments performed.
This type of KPI is more internally focused as no safety authority is going to set a number for the required frequency of risk assessments because it's so variable. But a leading indicator like this is going to be one of the most important for the safety team because it shows safety participation ad engagement - and will reduce incidents in the long run.

The safety officer or team is going to use this dashboard and the safety KPI numbers (number of risk assessments performed per month etc.) to spot trends and issues over time.
A dramatic decrease in the number of risk assessments might show workers don't have the tools or information required on a specific job, or an increase in the number of incidents on a specific site would lead to cross-referencing that sites numbers against a different site.
So in addition to the above safety KPI's, safety officers and managers are going to want to track and calculate:
- Number of training hours
- Number of toolbox talks
- Number of hazards identified
- Equipment breakdowns
- Average overtime per person
All of this data leads to better decision making, which improves safety performance.
No matter how many resources you have to invest in 'safety', tracking safety KPI's is a critical part of operating a business.
The above safety KPI table and information will be good references for you no matter how extensive and sophisticated your current safety KPI tracking is.
Comment below if you have any questions, or have another safety KPI you think should be included in the table and article.
People in 80+ countries use this safety management system to set, track and calculate their safety KPI's in real-time.
