Dashpivot article – Power BI Construction Project Dashboard
Power BI Construction Project Dashboard
This post covers the core features of Power BI that relate specifically to building a powerful and effective Construction Project Dashboard.

What is a Construction Dashboard in PowerBI?
The construction industry involves complex projects like mega infrastructures, high-rise buildings, specialised facilities, urban development projects, environmental and energy projects, and many more. It also deals with many stakeholders who play important roles until the completion of the project, or even after they are completed. A PowerBI construction project dashboard is what organisations and construction companies need to keep all of these relevant data and information and utilise them to improve operations.
A construction project dashboard compiles all the construction data into one singular and centralised source of data. With data coming in from multiple sources, a dashboard consolidates all the information into one single view. This removes the tedious process of checking multiple tools being used by different contractors, departments, and teams. If the digital tools being used features real-time access to data, this will ensure that everyone will have up-to-date information about projects, progress, budget, resource allocation, operations, and more.
A dashboard displays complex data easy to digest. Organisations can use charts, graphs, KPIs and other visuals to interpret various data, analyse trends, and make conscious decisions. With enhanced opportunities to make decisions, dashboards facilitate better planning and adjustments, ensuring projects are on schedule. Additionally, communication between clients, contractors, architects, engineers, workers, regulatory bodies, and other stakeholders can communicate transparently because dashboards provide clear, true, and up-to-date data. Everyone is informed about the projects' progresses.
With a construction project dashboard in PowerBI, it’s easier to generate reports by simply automating the report generating procedure. Dashboards help organisations save time from manually creating reports when it’s just easy to make one in a few clicks. Overall, a construction project dashboard helps the construction industry from data entry in management tools, to integrating data into a data visualisation software, consolidating information into one visual, and generate reports.
A construction project dashboard doesn’t just track progress, it’s a tool that makes the dynamic and complex construction industry easier to manage and digest, while at the same time promotes transparent communication and proactive decisions-making between stakeholders.
How Important is Power BI in the Construction Industry?
Power BI is an extremely powerful visualisation tool that helps solve the major challenges and causes of complications to project managers and anyone involved in experience in the construction industry.
Construction projects involve numerous stakeholders, and they may use different project management tools across different projects, fields, teams, and more, which result in scattered and dispersed data across the platforms. Sometimes project managers and executives make decisions from outdated information due to delays in updating data in the system or lack of a unified visualisation. Manual data entry or collection from workers and employees increases the risk of mistakes and inaccuracies, too. With a lack of a centralised tool, organisations would put more effort into collecting data to identify and monitor KPIs, which also in turn leads to delayed responses and decision-making to problems. The dynamic construction industry faces a number of challenges and with the high demands of the market and limited budget, organisations can’t afford any delays.
The role of Power BI in the construction industry is it transforms raw and unorganised construction data into a unified, comprehensible source of information project managers and executives can utilise to create data-driven and informed decisions. It has the capability to integrate data from multiple project management tools most organisations use nowadays into one consolidated data.
Project management tools aid in workflow management, task tracking, project planning, scheduling, resource management and many more and organisations can sync these data to Power BI for analytics, visualisation, and advanced reporting. Many teams may use different project management tools, so having Power BI’s integration capabilities is useful for organisation to centralise everything.
What Common Challenges are there in Construction Management that Power BI Can Help Address?
Scattered Data Across Multiple Projects or Sites
Projects involve a lot of key players with multiple contractors, subcontractors, suppliers, and more, and they use different tools and systems for construction management and data collection. Construction projects are not limited to one location, too. Some still even rely on manual data collection like using spreadsheets and physical papers because they don’t utilise digital tools for data input. With these factors, construction data is scattered. With data coming from different platforms and manual input, it is time-consuming to consolidate all that information and create reports for the management and executives. It can also be troublesome if all information is not aligned.
Because data is in a lot of platforms and software, it will be extremely challenging to integrate them. Teams, contractors, subcontractors, suppliers, or anyone use different tools for communication, scheduling, management, budgeting, and procurement. It’s a mess to even think project managers and executives to be opening multiple software and tabs just to view information. This challenge especially disrupts the workflow.
Discrepancies, Inconsistent Data, and Delayed Insights into PowerBI
The construction industry is dynamic and complex, and with using multiple platforms It’s bound to have discrepancies and inconsistent data being disseminated across stakeholders.
Even manual input is a factor for inconsistent data collection. Papers could be lost or tampered with. In a fast-paced workplace, penmanship may not be readable or employees might delay their reports. This eventually leads to delayed insights with an added factor of back and forth communication for data clarification.
It’ll be so much more convenient if data collection was accessible to everyone in real-time and consolidated data is generated automatically without refreshing the site.
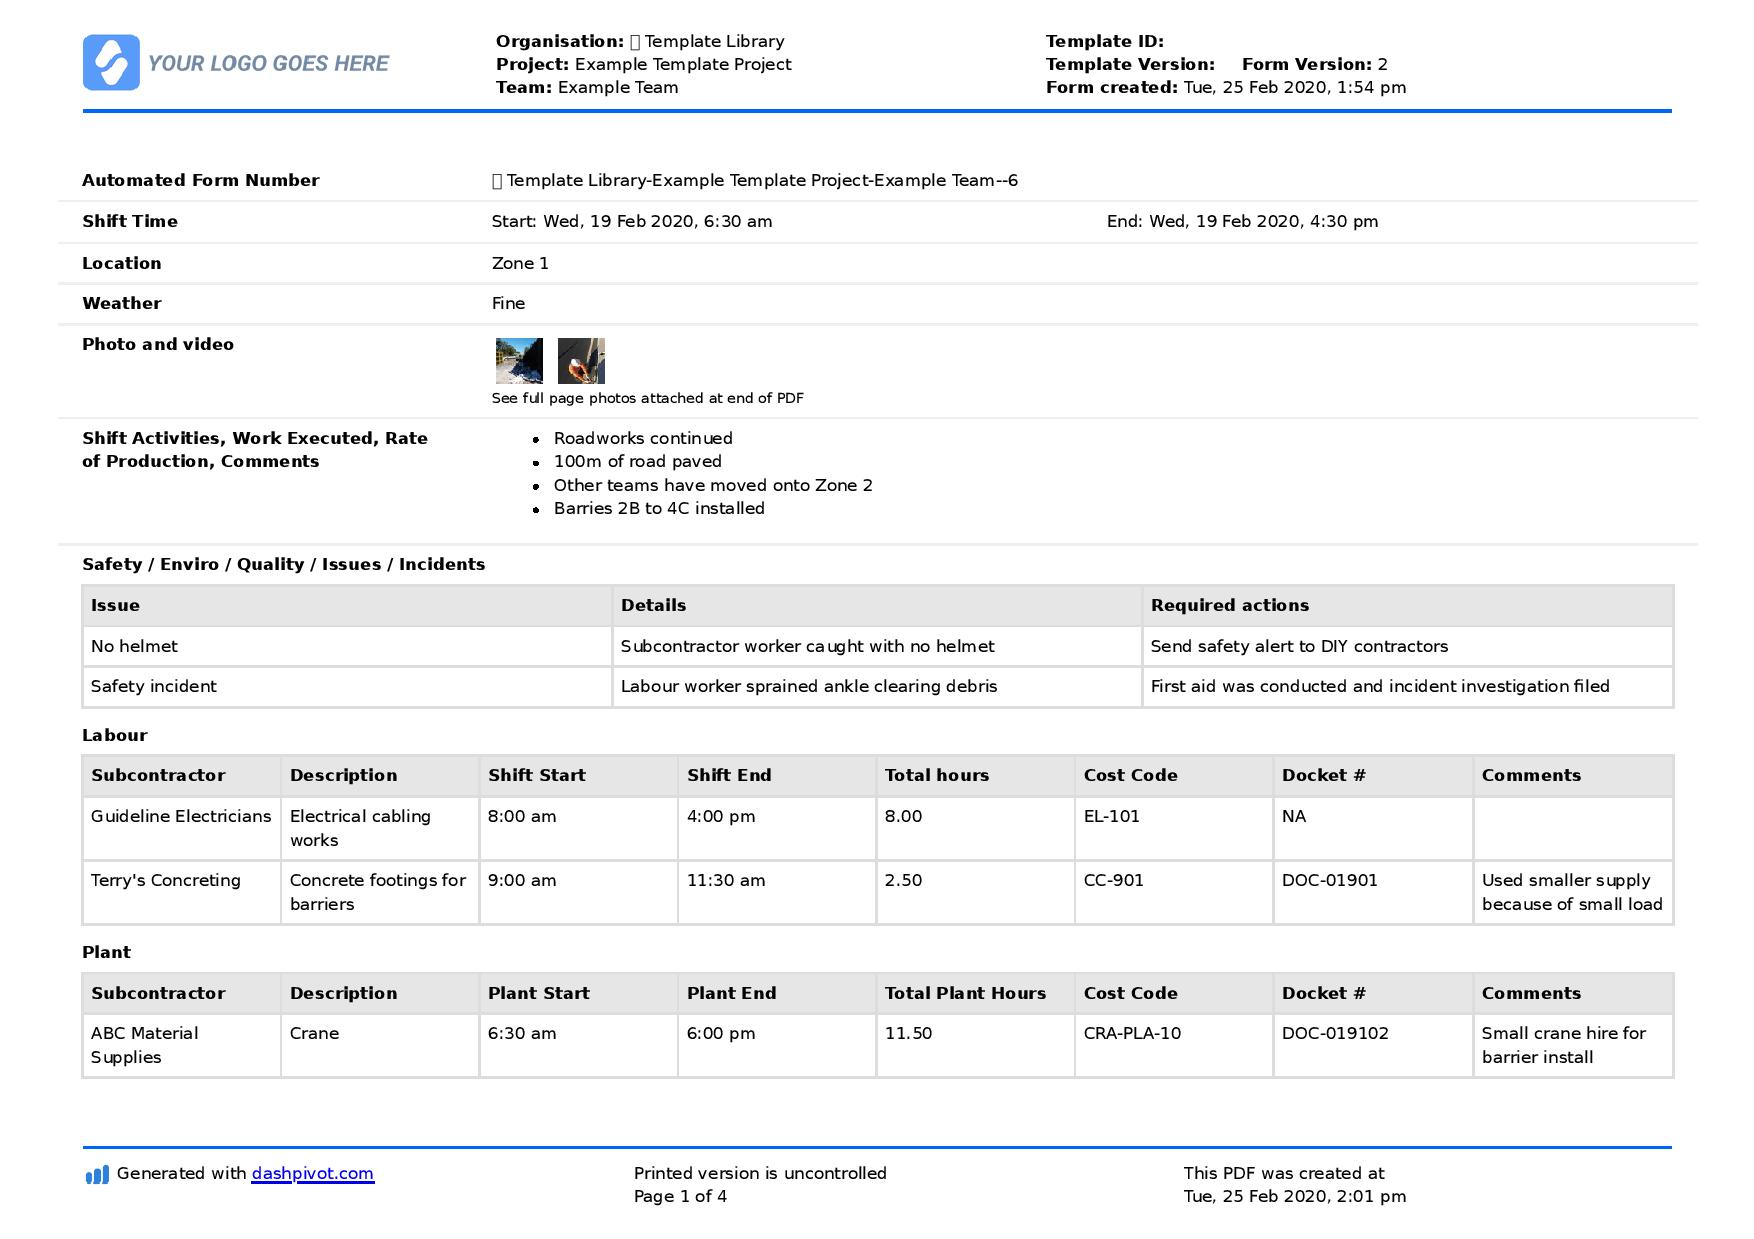
One of the best first steps you can take for your PowerBI construction project dashboard is to start collecting data electronically. For example, using a Site Diary App to collect daily project data and send that back into your office and dashboard.
No Real-time Access to Data for PowerBI (or other tooling Data Analysis
Without real-time access to data, information being relayed to project managers is outdated and without the proper tools for data analysis, employees have to go through the rigorous process of collecting information with back and forth communication to clarify outdated data and then proceed with the actual data analysis. It’s time-consuming. If the organisation could have the proper tools to automatically analyse complex project data effectively with real-time data, things would be more efficient


Use this site form template to send data to your Power BI construction project dashboard
How Does Power BI Improve the Functionality of Construction Project Dashboards?
Power BI improves construction dashboards by streamlining construction project management. Its key features include consolidating data into a single dashboard from multiple sources, real-time tracking, analytics and project insight, accessibility or on-the-go feature, collaboration tool, and interactive reports.
These features of Power BI transform raw unorganised data and how organisations transform data into accessible and holistic views, significantly improving, streamlining, and boosting the functionality of construction dashboards making it easier for organisations to monitor progress, keep in track in the budget and timelines, and oversee resources effectively.
What are the Common Metrics Tracked on a Construction Dashboard?
A construction dashboard is a visualisation tool that optimises key performance metric tracking. It tracks the project progress, timeline, costs, resource allocation, and many more. It provides real-time insights and promotes project transparency which ensures projects and tasks are delivered as scheduled, within the budget, and in the expected quality. Below are the most common metric tracked on a construction dashboard.
PowerBI for Construction Management - Project Progress/Timeline/Milestones
A common display or visualisation are progress bars that show completed tasks against the overall number or planned tasks. Milestone tracking include the progress of each project milestone and the deadlines. Other metrics may also be included, like the work completion rate to show the overall percentage of completed work relative to the schedule. This keeps all stakeholders like contractors, architects, engineers, project managers, and the management be on track with the schedule and budget. And if there are any deviations, they can make quick and informed decisions based on real-time and accurate data as displayed on the dashboards and progress bars.
Costs/Financial Metrics
There are dashboards showing the material and labour costs, costs variances, and financial allocation. This allows organisations to act on financial data effectively from centralised and visualised key financial metrics. With historical analysis and forecasting, Power BI can forecast financial performance based on history. Sharing dashboards to key persons are also made easy for collaboration. Dashboards may also include the cash flow projects based from actual cash flow history. In order to maintain financial stability, it’s essential to be able to track the money coming in and out within the team or organisation. This visualisation promotes accountability within team members and keeps the spending within the financial goals.
Resource Allocation
Organisations can track employee attendance, schedules, and shifts across different projects. Similarly, it’ll be easier to monitor assets like facilities, tools, and equipment. Dashboards can help optimise the allocation of these resources and determine which ones are underutilised or overutilised.
What Tool is Best Used to Create Construction Project Dashboards?
Power BI is arguably the best tool to use to create construction project dashboards. PowerBI construction project dashboards have flexible integration capabilities and a user-friendly interface, making it easier to connect to tools and implement within the organisation.
Companies and organisations in the construction industry can optimise their project and cost management, and improve efficiency in operations.
It creates interactive and insightful dashboards, with charts, graphs, KPIs and more. Users can easily migrate data from project management tools, spreadsheets, databases, cloud storage, ERP systems, Digital Forms and Apps, or APIs.
How Can Digital Tools Collect Data and Migrate this Construction Data Into Power BI?
Using digital tools is a game-changer for the dynamic and complex construction industry. It saves a lot of time, data is all stored in the cloud, it’s convenient and accessible, it promotes overall efficiency, and promotes collaboration among team members.
Although digital tools are game-changers for companies in the construction industry, it’s still important to know which ones are compatible for the business. Having too many digital tools causes scattered data, leaving confused workers and employees to ask which ones are for particular uses. Training new and existing employees on how to use the digital tools may also take a while. It’s ideal to use digital tools that are convenient, simple, easy, and user-friendly.
Data Collection
There are various digital tools around, but the best one that addresses the needs and demands of the construction industry is Dashpivot. It’s convenient, simple, easy, and user-friendly. It streamlines the entire data collection process and gets your workforce and relevant information on the same system. With a centralised database, it promotes collaboration between employees in site and in the office. With a couple of clicks, they can make forms, capture and store data, upload photos and videos, retrieve information, automate and analyse data, and many more. It’s a flexible digital tool intended to eliminate manual data entry, spreadsheets, static folders and clunky apps.
(about creating forms)
Dashpivot has a flexible folder system. Organisations can make it so that only certain employees have access to specific folders only applicable to them. Managers can layer permissions to maintain data security and avoid anyone from accidentally editing or deleting documents.
Teams can even build analytics inside Dashpivot to track information collected in the forms. There’s an option for custom dashboards and charts that you can easily create from all data in your forms. Make informed and conscious decisions by using Dashpivot as your data collector and information management system.
Connecting to Power BI
Multiple data sources like project management tools, spreadsheets, database, cloud storage, ERP systems, digital forms and apps, and APIs are all data sources that can be migrated into Power BI.
To migrate data in just minutes from an information management system like Dashpivot, Flowsite’s Power BI integration feature makes the process easy and simple. With just a few clicks and triggers, data can be moved. This eliminates the unnecessary manual input into PowerBI.

Data Visualisation, Publishing, Sharing
Power BI has interactive and custom visualisations like dashboards, bar charts, line graphs, maps, gauges, and more. Organisations and teams can create advanced analytics and reports based on the visuals. These will make it easier for stakeholders to make informed decisions, and mitigate risks and problems.
How Can Dashpivot and Flowsite Help Your Team Create a Project Construction Dashboard in Power BI?
Dashpivot and Flowsite are digital tools that can fortify your organisation’s information management system and integration capabilities. They’re convenient tools that work hand in hand from capturing and managing data on site, to seamlessly integrating with Power BI in creating interactive and insightful project construction dashboards.
With Dashpivot, your team’s data collection processes on site are simplified. You can capture data on the spot using your mobile phone or tablet. Capture information by using your standardised forms in Dashpivot like checklists, forms, logs, reports, and many more. You can attach photos and videos, with notes, mark-ups, tags, and more. Customise your forms ahead before getting into the site and easily fill out forms and documents on-the-go. Even offline, data will be synced once you’re connected to the internet. You can also create dashboards and charts in Dashpivot directly, and simply retrieve data from your database in Dashpivot. With just a few clicks and your team can fill out forms and share to fellow team members.
For advanced analytics, Power BI comes into the picture. And with Flowsite’s Power BI integration, you can transfer Dashpivot data and create comprehensive and consolidated data in Power BI. Without code, and with just a few clicks, you’ve built customised dashboards, visuals, and reports ready for collaboration.

Site diary template
Complete and organise your daily diaries more efficiently.

Site Inspection Report template
Improve your site inspection reports using this flexible format and proven framework for those all-important site inspections.

Snag list template
Don't let snags get in the way of project completion.
Sitemate builds best in class tools for built world companies.
