Safety – Safety metrics examples
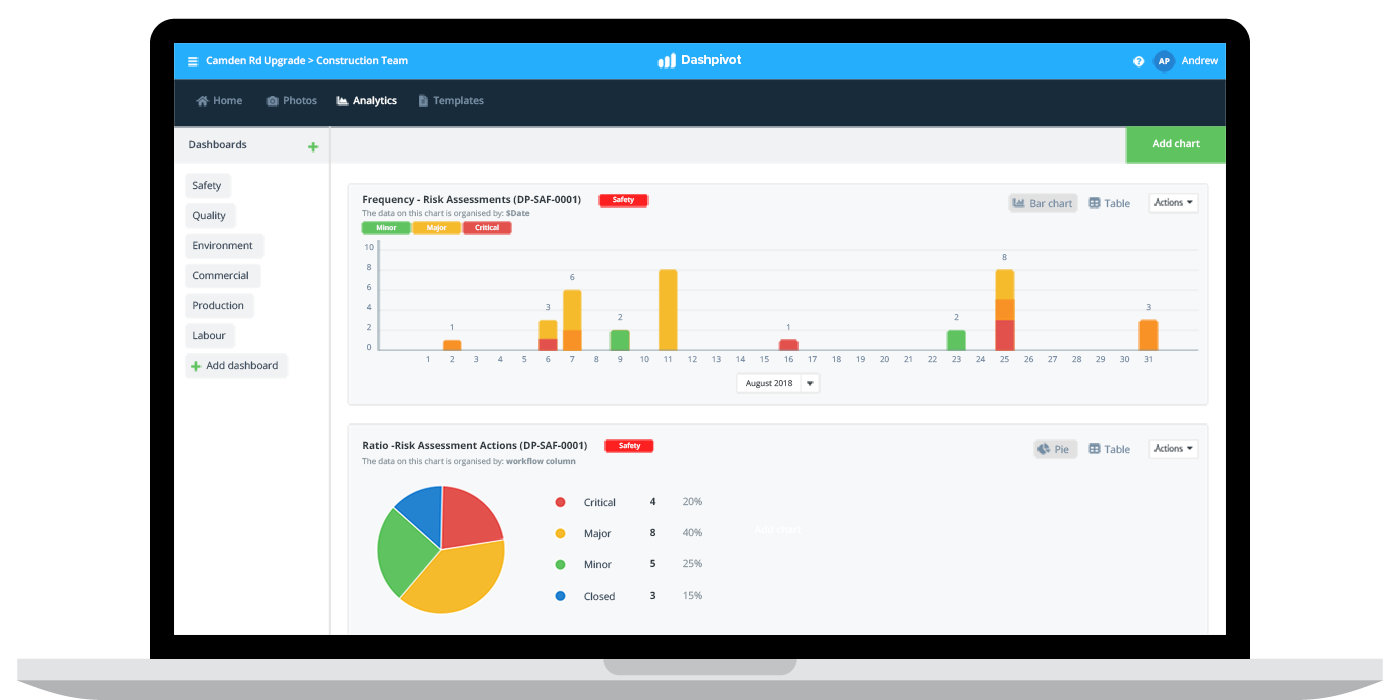
Safety metrics examples
Why should you care about safety metrics?
All companies understand that it is crucial to create a safe working environment where people can come, do their job, and go home after work. Companies understand this from a moral standpoint, and are acutely aware of the financial and reputation issues associated with not keeping their environments and people operating safely.
The next most important part of 'safety' as a function is to create and manage safety procedures and processes which enable companies to properly measure their safety outcomes so that they can understand what's going right or wrong - and improve it over time.
Without being able to measure and understand what's happening, attempting to improve safety outcomes is a shot in the dark, and there will be more potentially avoidable incidents and accidents and slow (if any) improvement over time.
Safety metrics are the 'scoring' system and measure by which companies, teams and workers measure safety performance. If the metrics or 'score' improves, then we can assume that safety is improving (with some caveats of course).
We need to care about safety metrics because the metrics tell us how we are performing, and give us data-backed ideas as to how we can improve. Caring alone is not enough. We need objective data.
Safety metrics don't tell the full story of course, because we cannot always assume a causal relationship between our inputs and outputs and metrics fluctuate with natural changes.
But over time, good safety metrics displayed in a standardised and consistent safety dashboard can paint a very telling story about safety on your projects, sites or at your entire organisation.
Safety metrics examples: Which safety metrics to focus on?
The safety metrics which you need to care about will be somewhat dependent on the industry or industries you operate in.
For the safety metrics examples below, we will be mostly focusing on the heavy industries including construction, manufacturing, agriculture, mining etc.
These are high risk industries where safety negligence can have dramatic consequences.
Some of these safety metrics are applicable across all industries and sectors - specifically the ones around general wellness. But there are some obvious differences between the safety needs on construction sites to an IT office.
There are also two main 'types' of safety metrics which work together to cover the safety spectrum:
Lagging indicators - Lagging indicators measure a company's 'past' performance i.e what has happened. Lagging safety indicators are often the most publicised safety metrics, as they include the headline stats like recorded injuries and incidents.
Leading indicators - Leading indicators are the measures which can indicate future performance; the indicators which are input focused and not results oriented (but which are expected to impact results). Common leading safety indicators include safety training and safety audits.
With all of this information and context behind us, we can dive into the safety metrics which we need to focus on.
Number and types of incidents
One of the must fundamental and necessary safety metrics is of course the number of incidents which have occurred over a specific period of time.
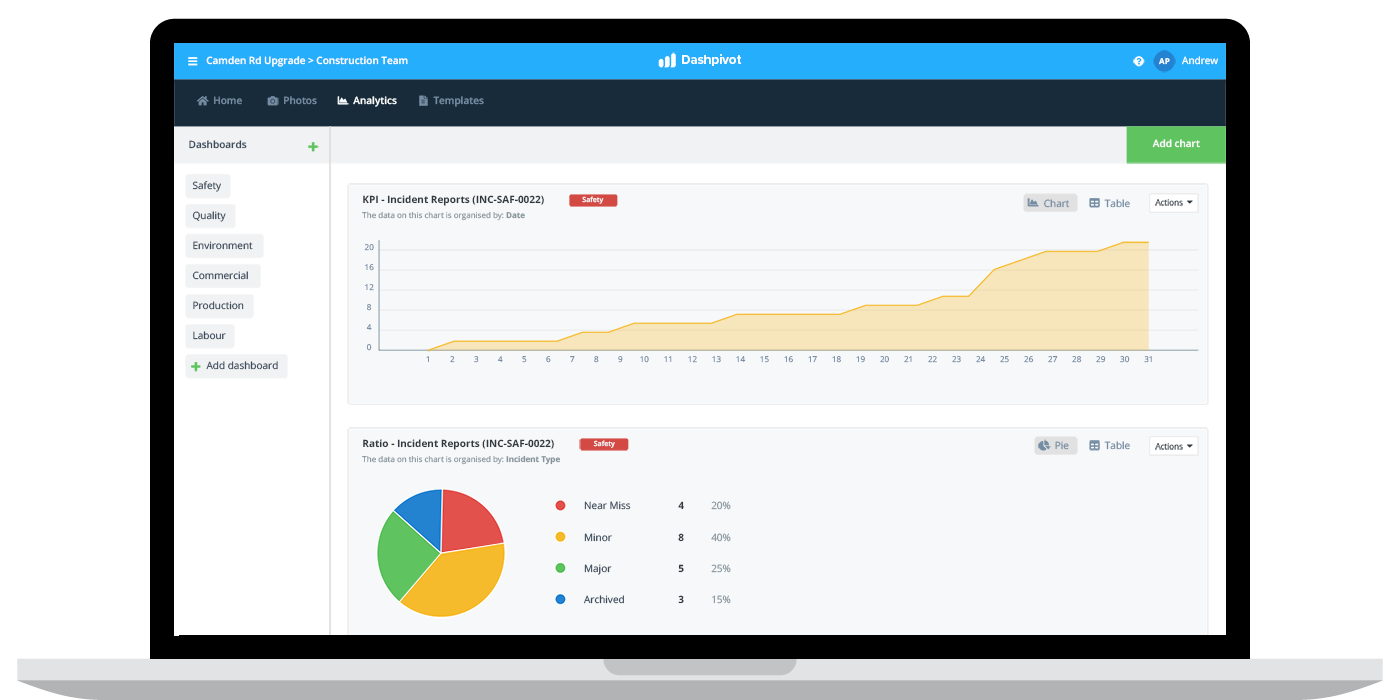
This number alone is important, but being able to effectively segment the number is equally important, with metrics on how many incidents have occurred on specific sites or specific teams being invaluable data in finding low performing or problematic areas of the business.
A secondary safety metric on top of the sheer number of incidents is the type of incidents. 'Type' can obviously be spun a few different ways, so type might mean:
- Minor
- Major
- Critical
Or it could also mean:
- Machinery
- Vehicle
- Working at heights
How you break down this safety metric will be based on the type of work you do - but you can see the power of these metrics in solving safety issues. This is also one of the safety metrics which is non-negotiable for auditors and authorities, as they too need to know where and why incidents are occurring - and who is responsible.
Using the right analytics tool, you can dive deep into the details on incidents.
Experience modification rate
Experience modification rate (EMR) is a lesser-known but very important safety metric which directly effects the bottom line.
The experience modification rate is a number or 'metric' which measures the number of claims against an organisation. It is an accurate measure of the tangible costs of past injuries and the cost of future risk.
EMR is important internally, but more important externally. This number is used by insurance companies to set and adjust insurance rates and workers compensation plans.
Reported near misses
Incidents are the most worrying safety events, but one of the safety metrics which also needs to be monitored 'closely' is reported near misses.
Similar to incidents, you'll want to understand where and what types of near misses are occurring - as well as how many.
The most important aspect of this safety metric is to ensure that workers are actually reporting near misses - or the data will be skewed and not representative of what's happening.
Creating a culture of safety, conducting toolbox talks and being generally open, transparent and encouraging about safety participation is hugely important in ensuring that people feel comfortable taking the time out of other 'productive' tasks to conduct a near miss report.
Safety audits and inspections
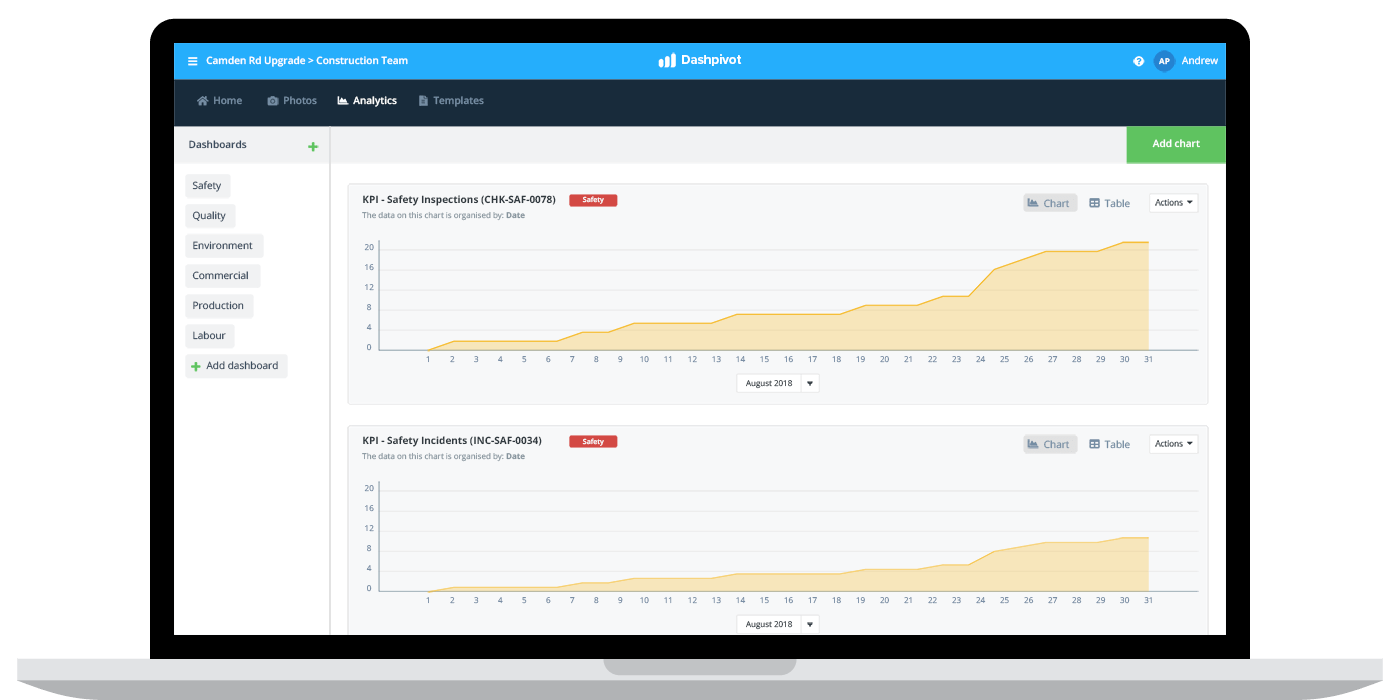
The safety metrics examples above are the all-important and more well-known lagging indicators. One of the more leading indicator safety metrics is the number and type of safety audits and inspections being conducted.
The idea behind these inspections and audits is to minimise risk by taking a conscious and intentional effort to inspect certain activities, spot weakness in processes and procedures, and to take a proactive approach to preventing incidents from happening in the first place.
At a high level, inspections are usually for activities taking place on site e.g a site visit inspection while audits are more focused on safety policies, procedures and findings.
The idea behind tracking this metric is that there should be a strong correlation between the number of inspections taking place, and the number of incidents occurring.
If you are having 'too many' plant or equipment incidents because of machine and vehicle failures, then you may increase the number of vehicle inspections. This should in theory lower the number of incidents, or you need to try and test a different theory.
This kind of informed decision making is the difference between progress and stagnation.
Corrective actions
The most important aspect of tracking any of these safety metrics examples is that they lead to some form of action.
This is why you want to make one of your staple safety metrics corrective actions.
Corrective actions are the actions or steps which are taken to correct the issues or findings discovered using many of the other safety metrics here.
For every increase in incidents or near misses, there should be a corrective action issued or implemented - after the necessary thought and discovery has been conducted of course.
You don't want to end up in a predicament where workers or teams are just doing corrective actions for the sake of it, but as long as you have a reliable framework in place for establishing when a corrective is required and what the action will look like - the more the merrier.
Project, site and worker safety participation
Good safety outcomes are the end-goal of safety metrics and safety management in general, but the inputs behind safety management are the key to improving those safety outcomes.
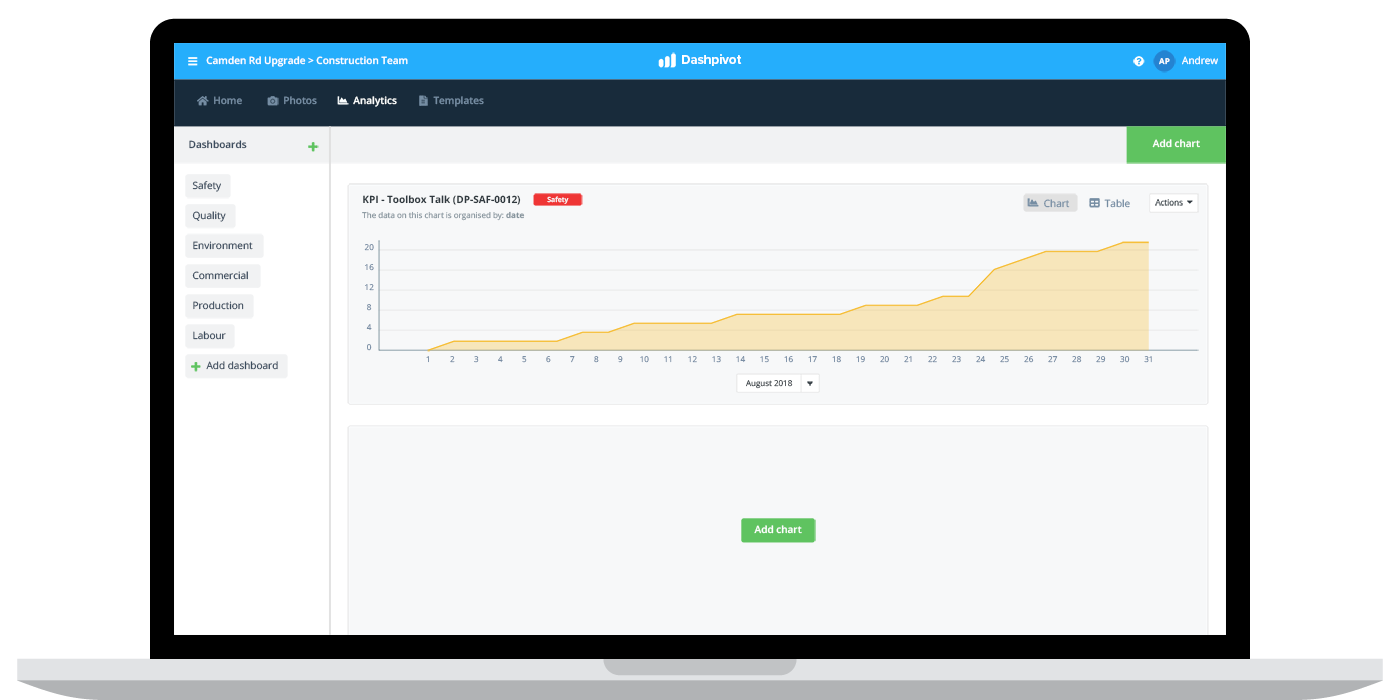
A core focus for many construction and industrial companies in recent years has been been safety participation in the form of training sessions, inductions and every day practices like toolbox talks.
Tracking this safety participation can be more difficult than the obvious incidents and other one off events, but the right safety management software and analytics can make keeping track of these more frequent inputs in an efficient manner easy.
Once again, this type of information can be really valuable. You can reference these safety metrics against the performance of specific teams, functions or projects - to see if increased training and focus on safety is improving outcomes and get plenty of other insights.
Injury and illness rates
In addition to company, project and site safety metrics and statistics, it's important for companies to leave room for safety metrics which focus on employee and worker well-being.
Wellness has become increasingly important for many construction and industrial companies, as years of evidence and an increased focus on wellness has brought certain issues to the surface.
While some of these metrics naturally involve variables outside of a companies control, it's still important for companies to be able to measure injury and ilness rates so that they can spot trends and patterns, and ensure they have both a happy and productive workforce.
ROI
And finally, all of these safety metrics examples and input cost time and money - and it is important that the company understands whether or not these investments are good investments.
Obviously companies can't pull out of investing in safety entirely, but they can track ROI across different projects and different teams to see where money is being well spent - and where it could be better spent.
It could be as simple as moving money away from formal training sessions to hiring a safety coordinator who can run regular toolbox talks etc.
ROI is important to every business, and safety needs to be judged based on efficiency too.
How to track these safety metrics examples, properly
Peaking about these safety metrics examples and talking about tracking them is all good and well, but how can companies do all of this efficiently - while still delivering projects on time and on budget.
The easy answer lies with using a smarter safety management system.
Tracking all of the above safety metrics examples with word docs, spreadsheets, PDFs and emails is almost impossible.
The number of hours required to reconcile all of the messy and unstandardised data floating around on sites is frightening for many business, not to mention the productive engineering hours lost for engineers scanning, uploading and manually entering information.
Instead, companies today who are doing safety metrics and safety analytics effectively are using simple and consolidated platforms - like you saw in the safety metrics examples above and below.
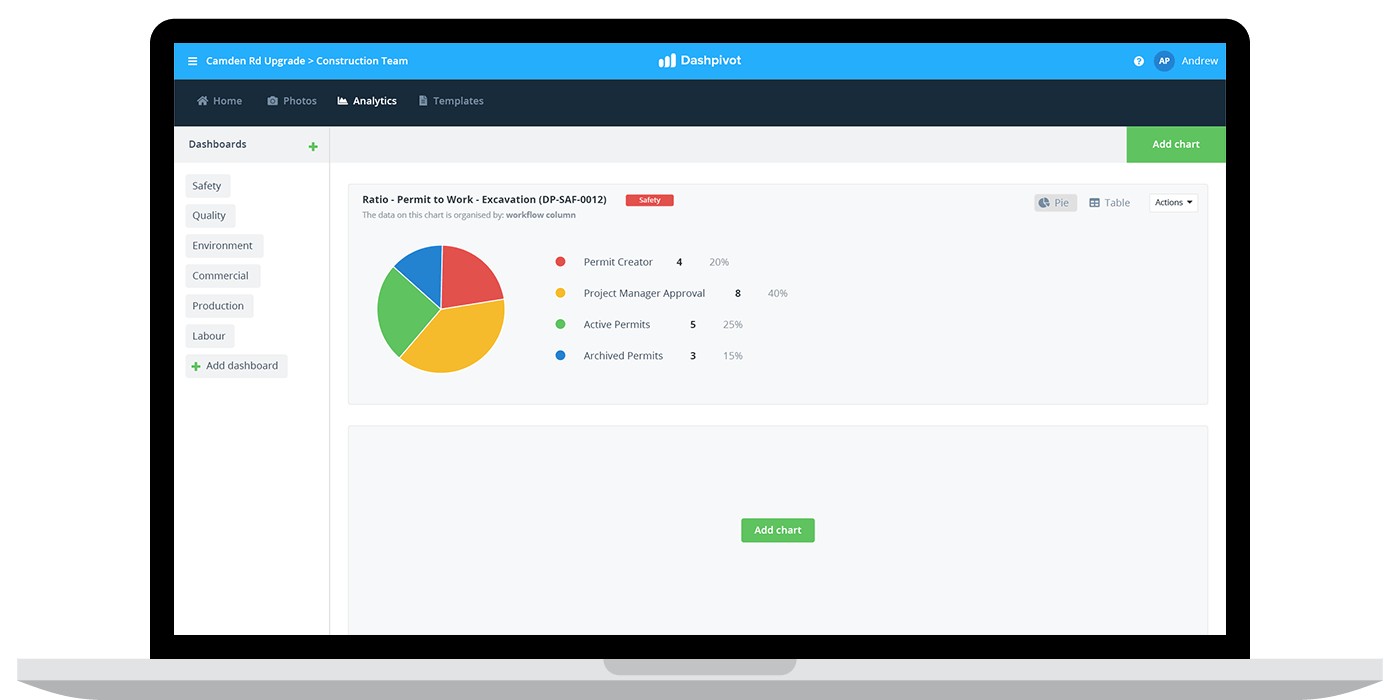
With a smart tool like this, all of the data flows and procedures are built into the system - and the software takes care of the data aggregation and standardisation - as well as time-consuming formatting.
The example above showcases what some safety permit analytics would look like in the system. This simple ration chart which is outlining the status of excavation permits on site is pulling data directly from the permits being filled out with the accompanying app.
Workers complete their permits using their phone, tablet or computer through automated workflows, and all of that permit information as well as the status of each permit is automatically sent into a neat dashboard like this.
This same level of efficiency can be applied to and scaled to any type of safety document or process across the business. Workers fill out information faster than ever, and the system takes care of all of the stuff happening in the background.
In addition to all of the saved time and money, the safety metrics are updated in real-time - which also means better and faster decision making.
Instead of looking at each safety metric in a silo or spending hours trying to bring them together, it becomes easy to cross-reference difference charts, filter to delve into details, and get amazing insights.
Use this system to stay on top of your safety metrics.
The future of safety metrics and workplace safety
Safety metrics continue to grow in importance in almost every business and industry. The last 50 years have seen a lot of changes and improvements in safety awareness and practices - and the last 10 have changed even more dramatically.
The changes in the last 50 or so years have been driven largely by cultural change.
Workers and companies have been making safety more and more of a focus, and the expectation from other stakeholders and society in general is that people today get home safe from work - no excuses.
Many of the changes in the last 5 or 10 years have been cultural as well. But the other powerful force driving change is technology.
New technologies have empowered companies and workers to better track safety metrics, better understand what's going right and wrong, and ultimately make more progress towards even safer sites and projects.
The next 5 or 10 years will be just as impactful.
The increased adoption of software, apps, drones and more, and the introduction of AI, smart hardware and other smart tools will enable companies to become much better at tracking the above safety metrics examples - and tracking new previously impossible ones too.
With more advanced tools, we will be able to crunch more numbers and understand data better than ever before whilst spending less and less time on admin.
A culture of safety and a conscious safety effort will still be incredibly important - but safety metrics will begin to tell a truer and more comprehensive story.
We will be able to fully rely on safety metrics and make quicker and better decisions about safety every day.
People in 80+ countries use this safety management system to track all of these safety metrics examples and improve their safety outcomes.
