Safety – TRIR Total recordable incident rate

TRIR: Total recordable incident rate
What is TRIR?
The total recordable incident rate or TRIR is a measure of occupational safety. The 'result' of the measurement, the total recordable incident rate, is derived from combining the number of safety incidents and total work hours of all employees with a standard employee group; typically 100 employee working 40 hours a week for 50 weeks of the year.

How to use your total recordable incident rate
The purpose of recording and measuring the TRIR is to understand how you, your safety team, and your company is performing on at least one dimension of safety. Because incidents capture and cover such a large part of the safety spectrum, it is one of the most common and useful KPIs.
There are a number of ways in which companies can use the TRIR - and ways in which a TRIR can be used against them.
Firstly, because it's common across use cases and industries, the TRIR offers a company an opportunity to benchmarks themselves against other companies in their industries as well as measure their own performance over time.
Insurance companies can and do actually use TRIR numbers to determine insurance premiums, especially for larger companies and projects.
A high or 'bad' TRIR can also lead to some unwanted attention, with a potential increase in the number of external audits and safety inspections, as well as potential fines. In fact, a TRIR of over 7 can quickly increase the likelihood of an inspection.
In the event of an audit or inspection, the auditor will look deep into your safety management or EHS management system to see your procedures, processes and the data behind the TRIR number.
In addition, a poor total recordable incident rate can be a red flag to potential employees and an undesirable asterisks for even the most reputable companies.
At the end of the day, the underlying goal of looking at these metrics is of course to lower or improve the TRIR, with the benchmarks and performance over time helping the company and decision makers to make good informed decisions.
Total recordable incident rate industry averages
Some industries are much more dangerous than some others, so it would make sense that those industries have higher total recordable incident rates.
And this rings generally true. Even though there has been an incredible amount of work done in the safety departments of construction and agriculture companies, the inherent dangers in these industries are very real and naturally lead to more incidents.
There is some good data on TRIR rates available, and some good articles published about recent trends and happenings.
Here is a quick rundown on some of the recent averages and numbers across some key industries (source):
| Industry | Incident rate (per 100 workers) |
|---|---|
| Agriculture, forestry and fishing | 2.7 |
| Mining | 1.4 |
| Manufacturing | 2.8 |
| Electricity, gas, water and waste services | 1.1 |
| Construction | 2.6 |
| Wholesale trade | 1.9 |
| Retail trade | 0.9 |
| Accomodation and food services | 1.1 |
| Transport, postal and warehousing | 2.4 |
| Information media and telecommunications | 0.5 |
| Financial and insurance services | 0.2 |
| Rental, hiring and real estate services | 0.8 |
| Professional, scientific and technical services | 0.4 |
| Administrative and support services | 0.7 |
| Public administration and safety | 1.2 |
| Education and training | 1.3 |
| Arts and recreation services | 1.9 |
| Other services | 1.1 |
| All industries | 1.5 |
As you can probably quickly see, the difference between the numbers doesn't appear that large, but when scaled across projects with hundreds of employees, it can make a big difference.
Unsurprisingly, the biggest outliers on the more incidents than average are heavy industries like construction, agriculture and transport, while the lower end is of course more office style work like admin and support services and financial services.
How to track and measure your TRIR
Many companies have great intentions when it comes to measuring and staying on top of their total recordable incident rates, but much of the difficulty of all of these safety metrics lies in actually recording them - and in reconciling them and managing them so that the final numbers are accurate.
When it comes to tracking the numbers, companies rely on workplace, field and site workers to report incidents. There are a couple of challenges here:
- Getting people to report incidents when they do happen
- Giving people the right tools to be able to report incidents properly
The first challenge mostly comes down to the type of safety culture you have at your organisation, as well individual personalities. Ensuring you create a positive safety environment where people feel comfortable taking the time to fill out incident reports is an ongoing effort.
The second challenge, giving people the right tools to be able to report incidents has been slower going for many companies then fostering a good culture of safety.
Many companies still rely on procedure posters, paper-based documents and partially digital documents like word and PDF to 'enforce' and funnel incident information into management, or the management system.
But these manual processes leave a lot of chance for people to forget to report an incident, ignore a normal procedure, or not scan and upload the incident report.
Companies who are managing safety more efficiently today have adopted and adapted to newer technologies.
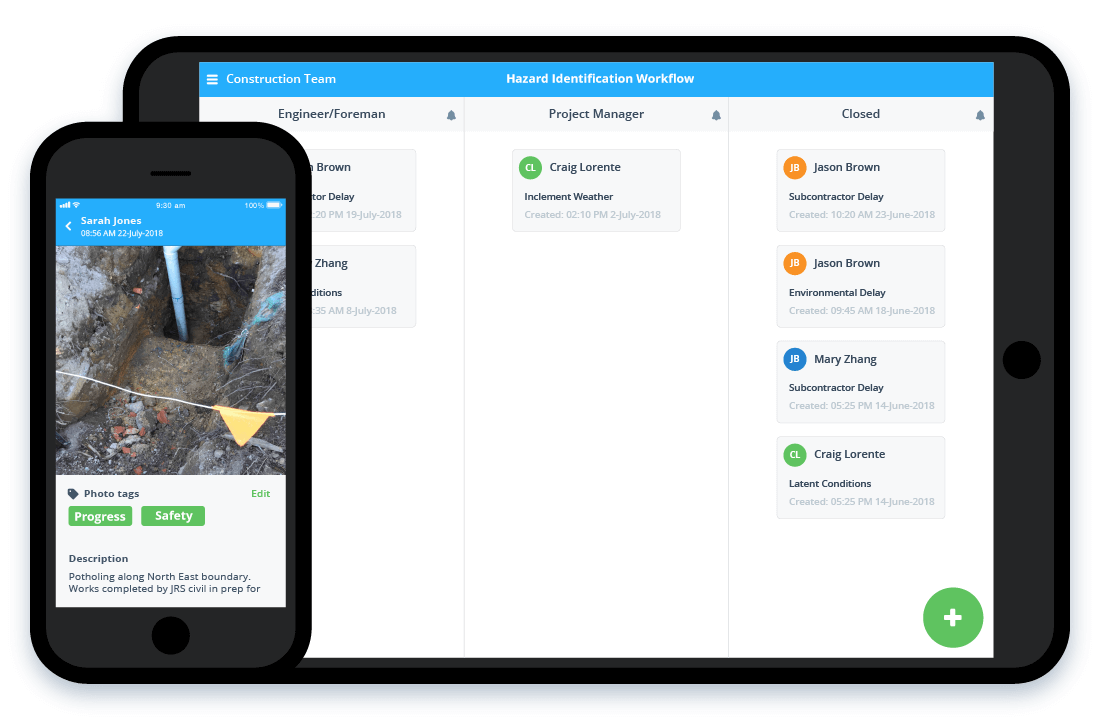
Using a smarter system, workers who encounter or experience an incident can simply open their phone, access the incident reporting framework or 'template' and complete the report.
Because these technologies are cloud-based, all of the incident reports are instantly synced to the cloud so that people can't forget to upload them or put them in the wrong place.
It also lowers the friction and effort required for workers to do incident notifications, which ends up having a strong impact on the accuracy of your total recordable incident rate 'number'.

Your total recordable incident rate ends up being a single number which you can calculate using your formula (more on TRIR calculations here).
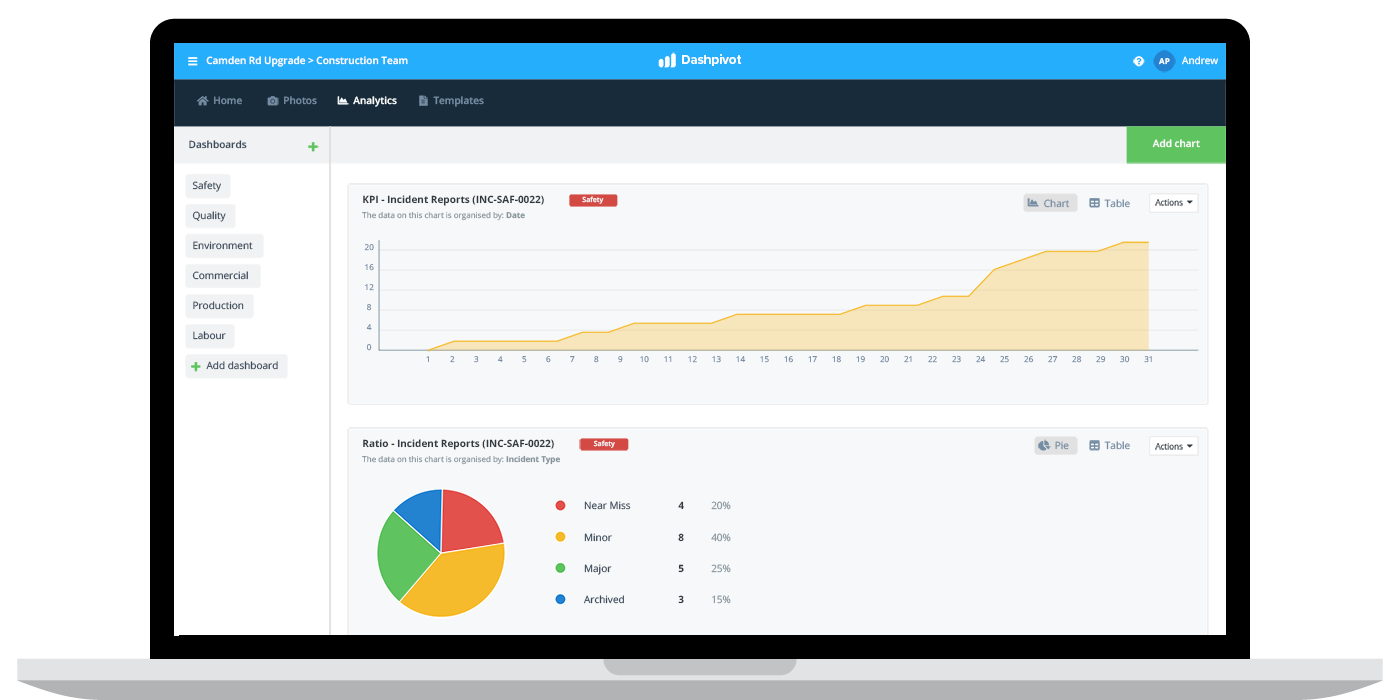
But just as important as defining your actual number is being able to track components of the calculation as well as other safety inputs in a safety dashboard.
As an example, you can see that tracking the number of incident reports over time in the below chart is great way to manage this important metric in real-time. Your TRIR might be calculated and discussed on a quarterly or annually basis, but being able to see that number and trend over time and in real-time can help you course correct before it effects the TRIR bottom line.
You can also use a system like this to easily calculate the number of incident reports in a given period, which could take hours when counting individual files or filling in excel cells.

Improve how you manage TRIR using this system.
Your total recordable incident rate is a really important metric, and it's one of those safety metrics which you need to stay on top of.
Workplace safety is a broad topic which encompasses a number of elements of health and safety, but reducing incidents and incident rates is going to be the quickest win in reducing other important safety outcomes including injuries, illness and fatalities.