Safety – All injury frequency rate

All injury frequency rate (AIFR)
What is AIFR?
The all injury frequency rate is the number of 'all' injuries per 1,000,000 hours worked. Companies use the all injury frequency rate along with a number of other safety KPI's to indicate health and safety performance.
Unlike many other injury rate caclulations, the injury frequency rate is designed to take a helicopter view of hazards, incidents and injuries in a workplace.
This does result in some weakness in the measure itself, in that it doesn't detail the severity or impact of the injury, but it is a good and generally accepted marker for indicating how safe a site or workplace is in general, and can be used to spot trends or red flags in normal operations.
The injury frequency rate formula and calculation
Calculating your all injury frequency rate is relatively straightforward when using the right formula and keeping track of injuries efficiently. The formula for calculating AIFR is:
AIFR = (Reported injuries x 200,000) / Employee total hours worked
The output of this all injury frequency rate calculation is your AIFR 'score' and indicates how many injuries are suffered when standardised across 100 employee working 40 hours per week for one year.
The formula can also be multiplied by 1,000,000 to get the injury frequency rate per million hours worked which is also a popular way of expressing the number.
The reason for calculating the numbers on this way is to calculate a 'rate' which can be compared to other years, projects and even other companies - so that a project with 50 people can be accurately compared to a project with 150 people.
The 'reported' injuries component of the calculation should include all injuries:
- Lost time injuries
- Restricted work injuries
- Medical treatment injuries
If you calculate each of these categories individually, then you can roll them into the AIFR rate to calculate that all injury frequency rate.
As an example, 'X' Construction Company might have 10 reported injuries over the course of 1,000,000 hours worked.
The AIFR calculation would be:
(10 x 200,000) / 1,000,000 = 2 injuries per one million hours worked
Injury frequency rates by industry
As was mentioned above, as well as being an important internal measure and yardstick for safety performance, injury frequency rate is also used by external parties, authorities and companies to gauge performance against the 'norm', and to benchmark themselves against similar companies.
There are some obvious and tangible differences across industries of course, so construction and heavy industrial companies typically experience higher all injury frequency rates than professional services and office-based jobs.
You can get a good idea of what injury rates look like across industries below. This data is from 2011-2014 and was pulled from UK companies.
| Industry | Injury frequency rate |
|---|---|
| Agriculture | 25.2 |
| Other production industries | 10.6 |
| Manufacturing | 13.5 |
| Construction | 12.7 |
| Retail/wholesale | 14.2 |
| Transport | 16.5 |
| Food/accomodation | 22.7 |
| Other business industries | 5.1 |
| Public administration | 12.5 |
| Education | 12.2 |
| Health services | 16 |
| Other service industries | 13.1 |
As you can see, and as is not surprising, industries like agriculture and construction experience much higher injury rates than many other industries. These industries have been bringing their all injury frequency rates down in recent years and continue to seek other paths to do so with the understanding that their industries are inherently more dangerous than many 'business' industries.
Tracking all injuries on your sites and projects
Documenting and tracking every injury in a workplace or on a project can be tough going. Many projects have hundreds of people working around mountains of equipment and machines and hundreds of delivered materials, and all of these moving pieces need to be documented and reconciled in a management or information system.
The companies who really struggle to manage and reconcile all of this data and then turn it into valuable insights and AIFR calculations are the companies who still use paper and rigid documents to capture all of this information.
Using paper, word docs and PDFs is time-consuming through multiple stages of the information chain. Workers spend more time filling out documents and admin workers and safety managers spend hours simply reconciling and organising data into buckets and spaces where it can be used.
It also creates a friction point at the documentation stage. If someone has to find the right document, fill it out manually and then scan it and email it later, there are multiple steps where things can get lost, misplaced or forgotten.
A far better approach to documenting and managing injuries and other safety information is to consolidate it into a single management system which is digital from end-to-end.
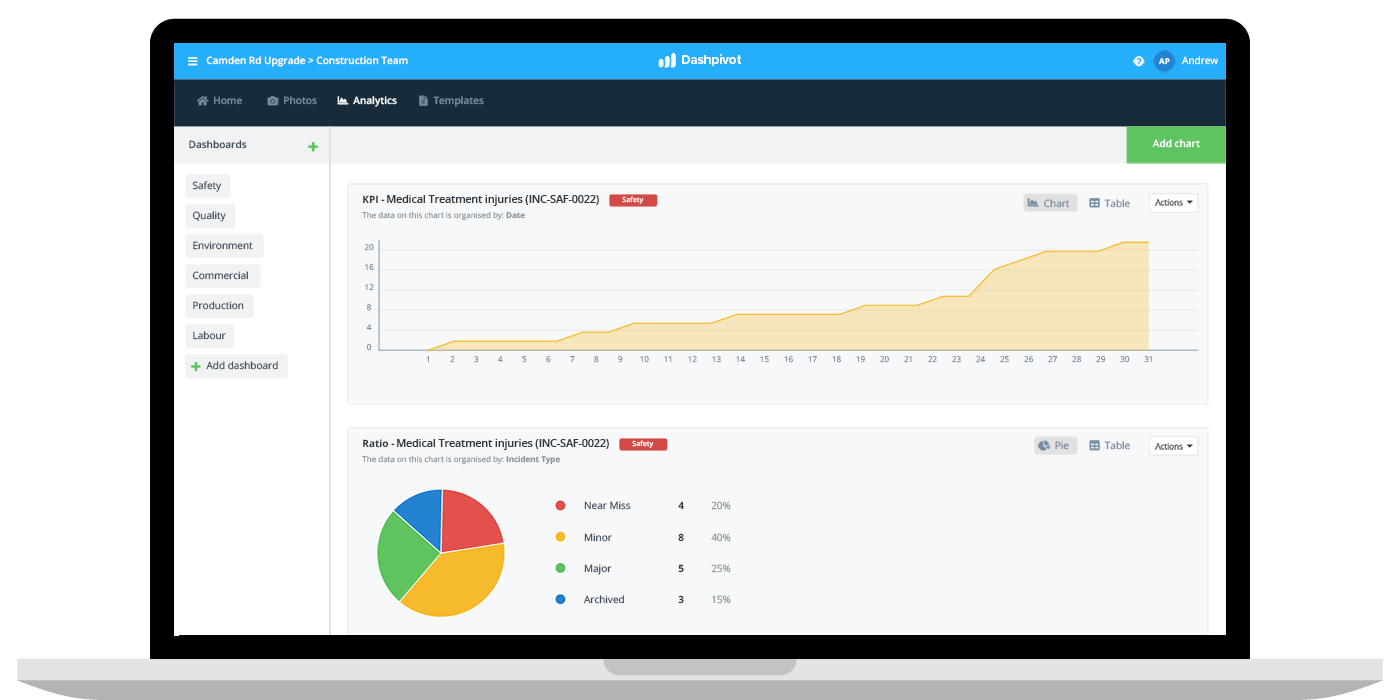
Workers on site can access and open incident and injury reports from their mobile or tablets, those records are instantly synced to the cloud where they can't get lost, and then all of that data feeds into dashboards which display the injury rates, incident counts and more.
There are many variables involved with lowering your all injury frequency rate - and one of those is how quickly you can understand what's happening, and how quickly you can make informed decisions about how to improve.
Constant improvement is everything with KPI and other performance measures. Improve your AIFR using smarter safety management software like this.

People in 80+ countries use this safety management system to improve how they get their work done.

See how you can easily streamline your systems and processes with Sitemate today
