Safety – AIFR all injury frequency rate

LTIFR - Lost time injury frequency rate
What is LTIFR?
LTIFR or the lost time injury frequency rate is a safety measure which refers to the number of lost time injuries occurring per 1 million hours worked. LTIFR will typically be calculated for a specific workplace or project, but it can also be expanded to measure safety in specific regions or industries as well.
The main variable in the lost time injury frequency rate is of course the number of injuries sustained during the measurement period. Every company is supposed to use the same 'definition' of a lost time injury which is:
All of the on-the-job injuries which require a person to stay away from work for more than 24 hours, or which result in death or permanent disability.
This threshold ensures that all companies can ascertain a pretty accurate LTIFR number without worrying about the nuances of minor scratches and injuries - but the weakness of this threshold is still that the severity of the injury outside of death and permanent disability is not factored into the equation.
LTIFR is often considered and referenced as the most useful safety KPI, and is generally considered to be the most reliable proxy for safety performance. Companies work hard on documenting and tracking lost time injuries so that they can measure and seek to improve their lost time injury frequency rate - and workers look at LTIFR's as a strong indicator of the safety of a specific company and the working environment they create and maintain.

Lost time injury frequency rate industry average
One of the most powerful aspects of safety KPI's is that they can be used to understand performance both from an internal and external perspective. While every company should be primarily focused on their internal performance and on tactics which can improve their LTIFR and other measurements, it is helpful to look at how your company or project compares to the 'scores' of peers and companies in the same industry.
Comparing apples to oranges isn't incredibly helpful e.g comparing the LTIFR of an insurance office to that of a commercial fishing boat, but comparing similar companies doing similar activities can bring a sense of urgency to the equation.
Unfortunately for companies with a high injury frequency rate, it can also be a red flag and negative indicator for auditors, inspectors and even business and project insurers.
As is expected of most safety metrics, lost time injury frequency rate industry averages can vary quite dramatically. While construction and industrial companies have made vast improvements in their safety records and practices, the nature of the work being performed often results in more injuries.
You can see some industry average numbers below (source).
| Industry | LTIFR |
|---|---|
| Wholesale Trade, Transport, Postal, and Warehousing | 2.37 |
| Manufacturing | 2.67 |
| Mining, Utilities, and Waste Management | 0.80 |
| Other Services | 1.91 |
| Construction | 1.02 |
| Information Media and Communications; Finance and Insurance; Property Services; Business Services; Business Support Services; Public Administration | 0.19 |
As is mostly expected, heavy industries like transportation and construction have higher LTIFR's than traditional office jobs.
As has been previously mentioned, these industry averages suffer from the same weaknesses as all lost time injury frequency rate measurements in that they don't tell the full story about the severity of the injuries which were sustained and suffer from all statistical errors in terms of samples sizes, skewed samples etc.
But these industry averages do paint a largely expected picture.
Once again, the nature of injuries of course differs between industries, but general workplace statistics indicate the majority of lost time injuries stem from familiar injuries including:
- Back and neck strains/strains
- Lumbar disc displacements
- Ankle sprains
- Knee contusion
- Knee cartilage tears
Lost time injury frequency rate benchmark
So what kind of lost time injury frequency rate benchmarks should you be setting for your company?
The answer depends on your current safety performance more than anything else.
Before setting lofty LTIFR goals based on industry averages and other general statistics, you need a firm understanding of your most recent LTIFR number, the LTIFR trend over time, the safety resources at your disposal and how you intend to lower or improve the result.
An LTIFR number is the output, and the culmination of many combined inputs which are a result of the processes and procedures you have built out for your company and workplace.
Using the LTIFR as an indicator of safety performance and success - as it was intended to be used - and focusing on improving every day safety practices is a sure way to set the lost time injury frequency rate benchmark.
While using industry leaders and other high performing organisations as a benchmark can help push you to a higher level of performance, it's important to be operating within the constraints of your work, resources, current standing etc.
Where benchmarking yourself against your peers is really helpful is in knowing your standing with regulators, authorisations and auditors. They look to these numbers for red flags, and then investigate and find out what's happening with the organisations who are outliers.
Smart ways to improve your lost time injury frequency rate
So it should be apparent that tracking, measuring and improving your LTIFR is an important part of running a business. Keeping workers safe is a moral duty as well as fiscally responsible, with healthy and happy workers being productive, and not costing you money in medical and legal cases.
So what can companies - especially the ones who have historically higher LTIFRs - do to lower and improve their LTIFR calculations?
Focus on inputs more than outcomes
It may seem odd to state this in an article about LTIFR, but one of the common themes flowing through the article is that LTIFR is not a perfect measure, and that focusing on daily safety activities and processes is a more effective way to actually improve your LTIFR - which is the end goal here.
Focusing on leading safety metrics over and above the more publicised lagging indicators like LTIFR and TRIR is critical to improving safety for the coming years.
In fact, focusing too heavily on LTIFR can even have a negative impact on future safety performance:
- If you had a really good LTFIR last year, you could be lulled into a false sense of security about safety, but the better than normal number could be more to do with the type of projects you worked on (correlation does not equal causation)
- If you had a bad LTIFR year last year, you could make drastic changes to safety practices which have been working well and improving a single different element of safety
It's important to focus and measure the leading indicators of safety too, because they are the drivers of improvement.
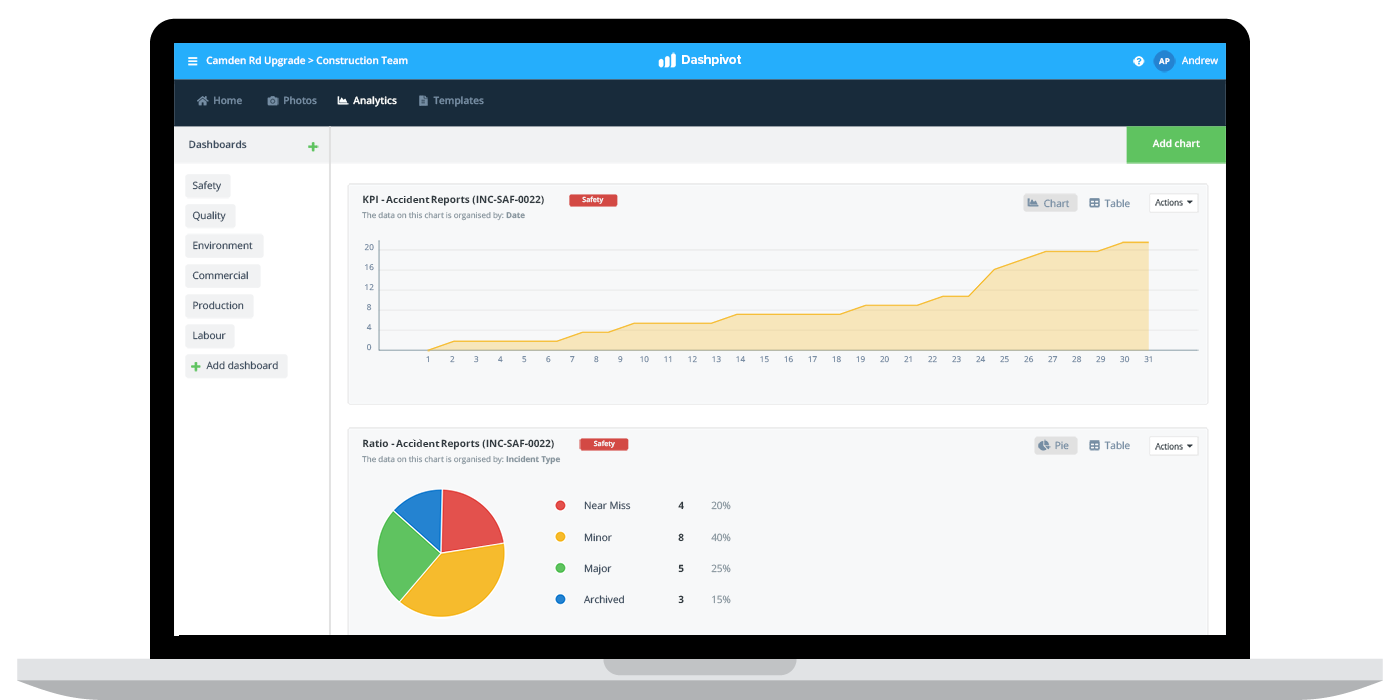
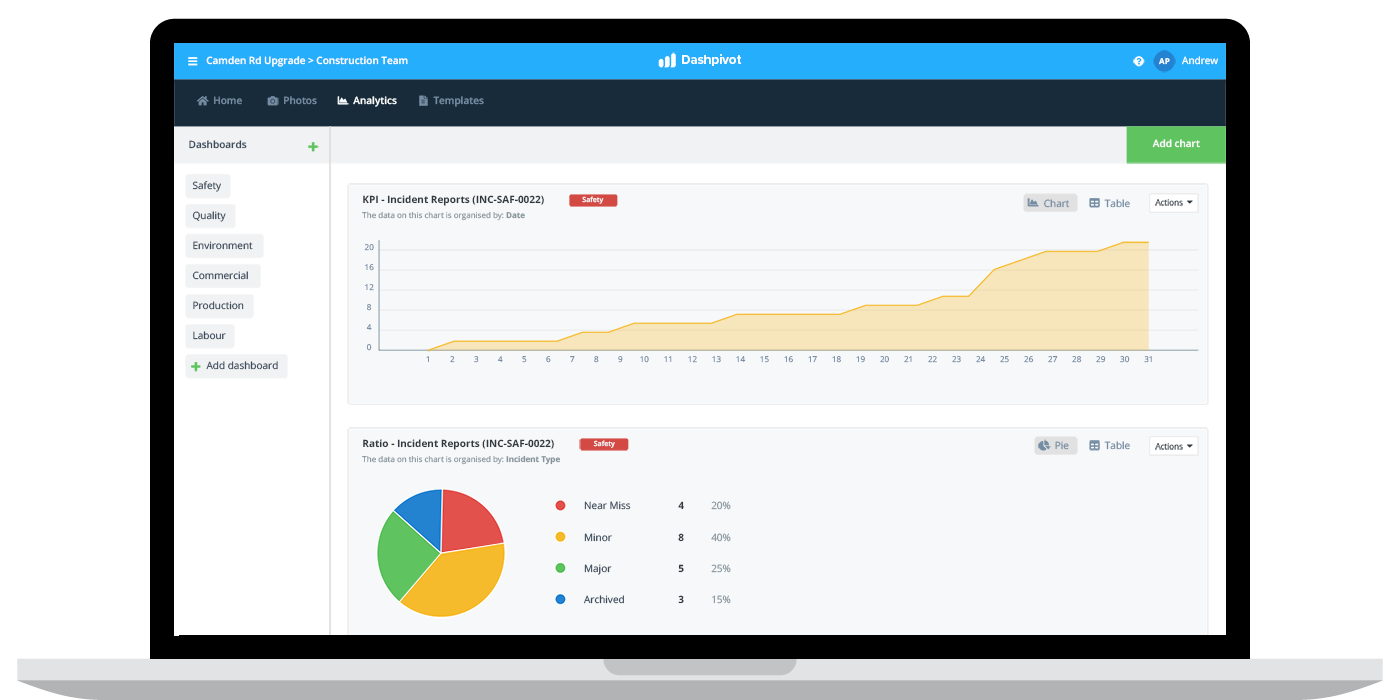
Use a real-time LTIFR 'scoreboard'
Many studies have found that being able to see and compare performance in anything makes it more likely that people will care about it and improve - and LTIFR is no different.
Have a place where management and workers on site can see lost time injuries across the business or project is a great way to bring transparency to what's actually happening, keep LTIFR top of mind, and create alignment around the common goal of improving the 'score'.
While it can seem daunting to management, it's an investment in improving LTIFR over and above worrying about short term perceptions.

Ensure workers have all of the tools they need to perform work safely
One of the most important aspects of improving your lost time injury frequency rate is giving workers the tools they need to do their jobs effectively and safely, from engineers and supervisors to labourers and inspectors.
When referring to tools and equipment here, it's important to realise that there are a number of tools and accessories which workers can use to improve safety on site.
Some of these are the obvious ones like PPE and good power tools; while others are less obvious like the tools workers have to conduct and risk assessments, permits and safety inspections.
Many accidents and lost time injuries could have been prevented from better risk assessments and more thorough inspections on equipment and other site objects, but many of these workers didn't do inspections or risk assessments properly or according to the standard procedure because they forgot a piece of paper or didn't see the procedure poster.
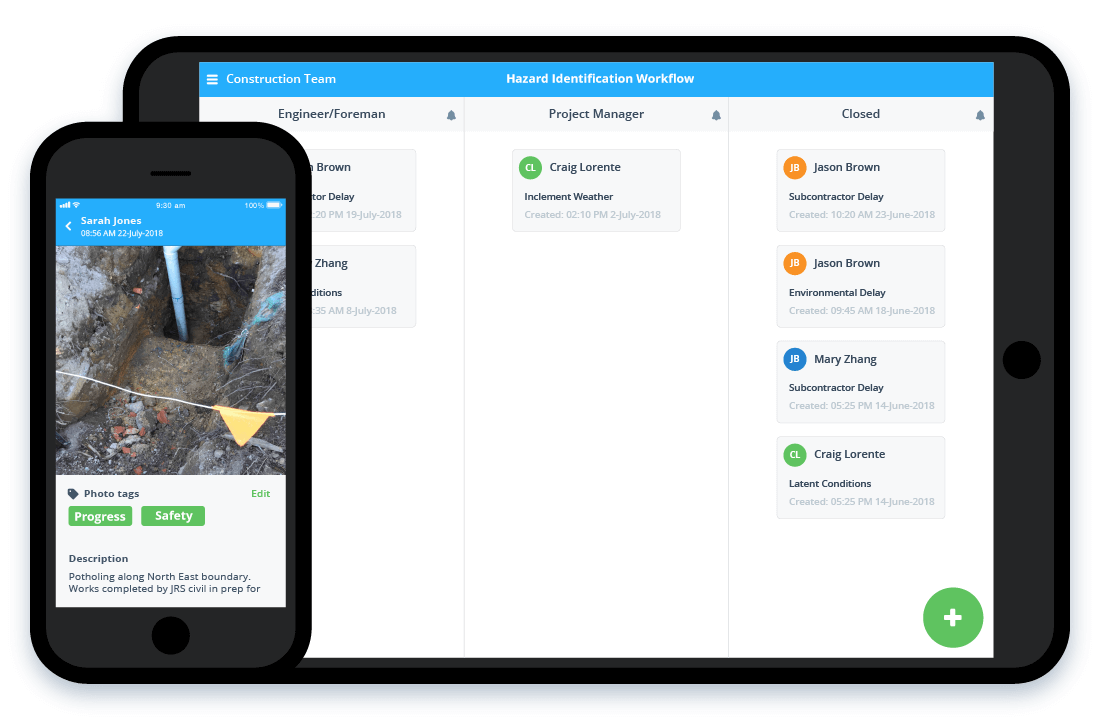
Putting smart workflow tools like apps and softwares into the hands of workers to enable them to do their jobs properly is a great way to improve safety participation and ensure everyone is conducting work and safety in the way it was intended.
These tools also connect the office and site, which has been historically disconnected due to problems communicating scheduling and progress updates.

Focus on culture and transparency
And finally, a huge part of lowering and improving your lost time injury frequency rate comes down to the culture of safety at your organisation.
All of the best tools and practices can be nullified if people aren't conscious and engaged with safety.
This type of culture starts at the top with management and safety teams and permeates through every level of the 'hierarchy'.
Toxic cultures where spending time on safety and reporting hazards was looked down upon are the type of environments where more accidents happen and more people get injured.
LTIFR is an important part of measuring safety performance, but more than that, it serves as a marker and talking point for companies and other stakeholders to come together and discuss how safety can be improved.
Safety is becoming more and more important to all workers and all companies, and lost time injury frequency rates should be improved in parallel with this increased attention.
People in 100+ countries use this safety management system to document, track and improve injury rates.
