Safety – TRIR calculation

TRIR Calculation: How to calculate and use TRIR
TRIR Calculation formula
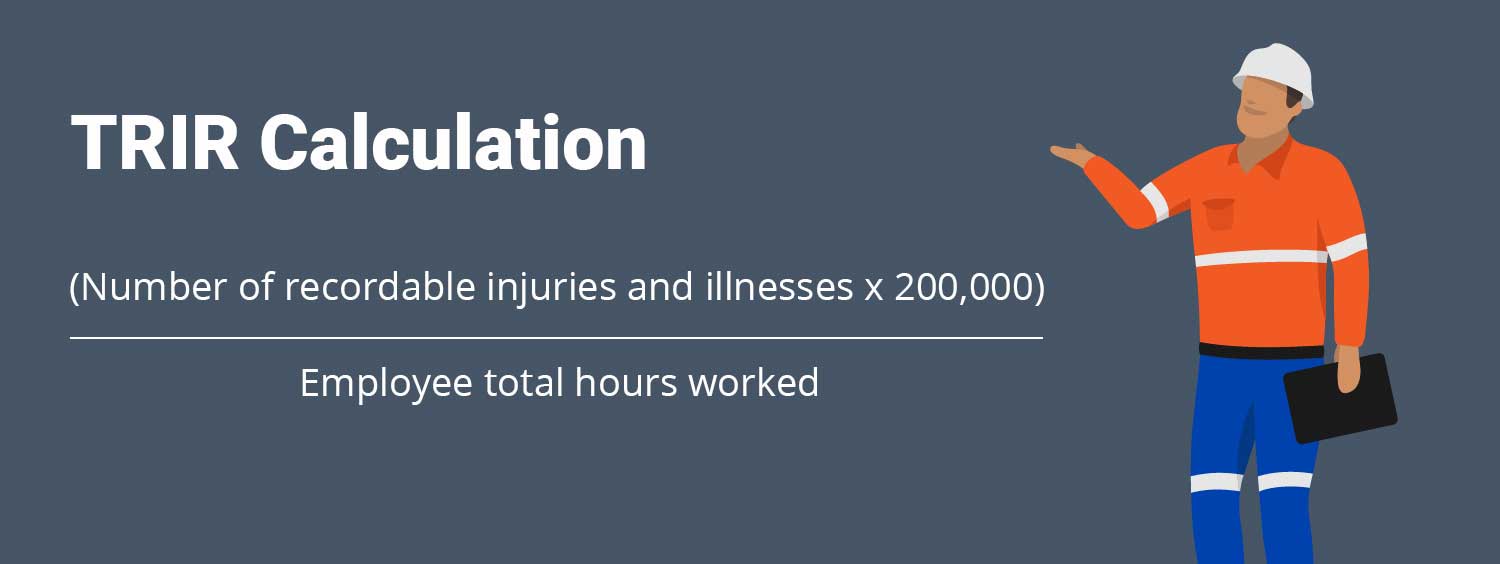
The TRIR calculation formula takes the number of recordable injuries and illnesses, multiplies that number by 200,000, and then divides that by the total number of employee hours worked.

There's only two custom metrics to worry about when performing your TRIC calculation using this formula:
- The number of recordable injuries and illnesses which have taken place in your workplace or on your sites
- The total number of employee hours worked
The number 200,000 in the formula is the way in which the TRIR calculation is standardised no matter what size the company is. The number 200,000 is 'found' by multiplying 100 employees by 40 hour work weeks by 50 work weeks during the year.
Once you divide this number by the total hours worked on your sites, you can measure your TRIR 'score' against other companies in industries or measure it against past performance no matter how many hours were worked in the period - because the result is now the number of recordable incidents per 100 workers over the course of a year.
Your TRIR safety calculation
So what does your TRIR safety calculation actually look like?
Here's a couple of example TRIR calculations which show you what it will likely look like with slightly different numbers to illustrate the ease of TRIR comparison once the calculation has been made.
For the first calculation, let's assume that company A is looking to assess it's TRIR on a project for the previous year.
During the course of that project, the company had 15 recorded incidents over the course of 117,000 employee hours (50 employees worked 45 hours per week over the course of 52 weeks).
So the formula would be:
(5 recorded incidents x 200,000) / 117,000 = 8.5
The resulting 8.5 is a high TRIR rate for most industries (and even high for some of the more dangerous industries), which shows the bar and expectations for TRIR safety is set pretty high.
You can some more TRIR industry averages here.
TRIR calculation for small companies
Some companies worry that their TRIR calculations will be skewed because of their size, but the number is standardised through the 200,000 in the calculation.
For example, for a company with just 10 employees who experience 1 incident over the course of two years, the TRIR calculation will be:
[(1 x 200,000) / 20,800] / 2 = 9.6
The law of small numbers does of course apply here, where the difference between 0, 1 and 2 incidents is tiny - but the derived calculation result difference is huge.
So it is a little tricker for small companies and small businesses, who may find it helpful to have an average TRIR over the course of a few years in order to build a better baseline number which isn't as skewed by an incident case or two.
How often to calculate total recordable incident rate
You can calculate your TRIR rate using the formula above for any period of time.
If you want to calculate a quarterly TRIR rate, then you would simply take the number of incidents which occurred during those three month, still multiply it by 200,000 and then divide it by the number of hours worked in that 3 month period.
The problem with doing TRIR calculations within smaller periods of time is the same problem that small companies face: the law of small numbers dictates that one or two incidents can have a dramatic impact on the outputted TRIR number.
For this reason, most companies do measure TRIR on a slightly longer timeframe, unless it's a mega-project or large company with thousands of thousands of hours being worked.
TRIR is a lagging indicator anyway, so measuring it accurately is more important than measuring it quickly.
How to influence TRIR in the short run using long run scores
As we have described above, most companies don't have the luxury of being able to use TRIR calculations as their up-to-date safety score which they can lean on for making daily, weekly or monthly decisions.
Because of this, it's essential that companies also focus on the short term leading and lagging indicators which they can rely on for tracking safety in real-time.
Some great examples of some of the metrics and KPIs which safety teams and managers should be across on a more frequent basis include:
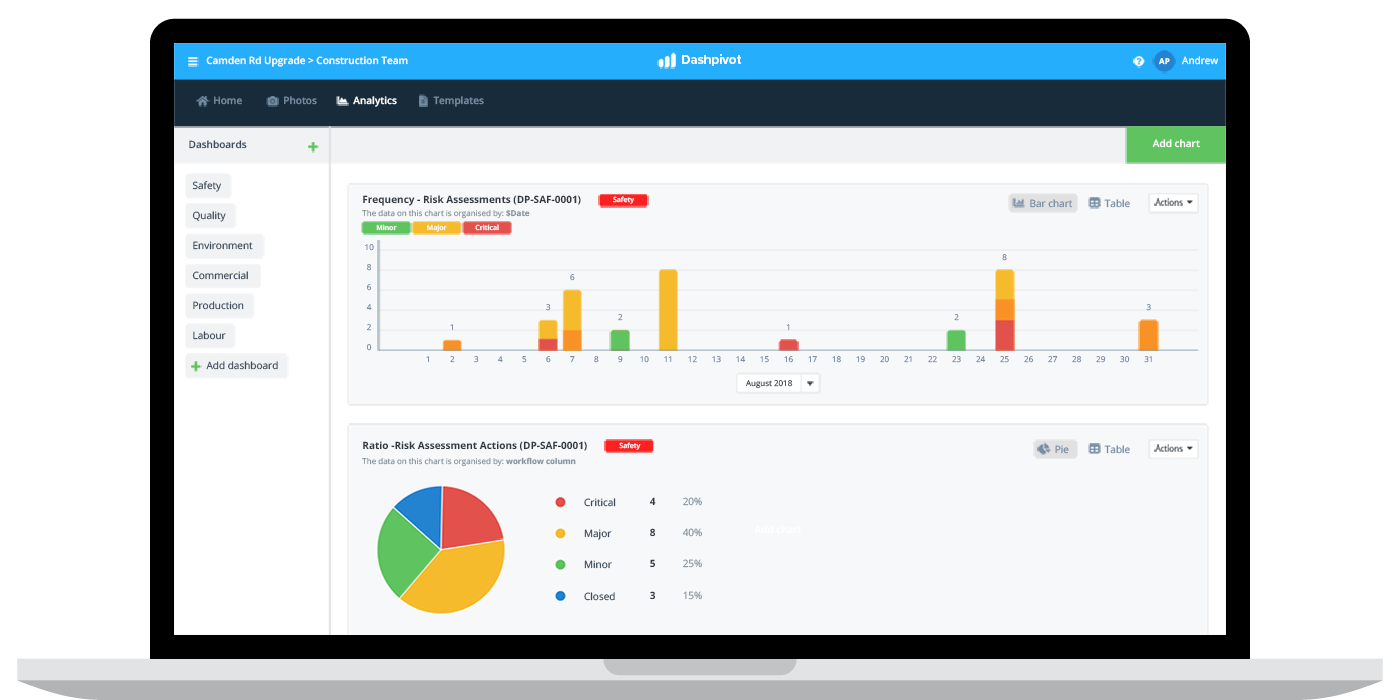
- The number of risk assessments being performed
- The number of equipment inspections being conducted
- The number of safety permits outstanding
- The number of safety training hours in the last quarter

These are the key indicators which influence that TRIR calculation every day. Focus on the safety inputs, and the safety outputs will improve.
TRIR calculations are a really powerful high level tool for understanding safety performance, and for benchmarking a project or company against previous performance as well as other leading performers in the space.
It's these measures, along with the day-to-day operations and safety processes as well as the safety culture you create which combine to create a safe and viable working environment for all stakeholders.
People in 100+ countries use this safety management system to improve how they get their work done.
