Construction – Construction s curve

Construction S-curves: Everything you need to know about the S-curve
What is an S-curve?
The construction s-curve is a graphical report which displays the cumulative progress of a project, and is a tool which construction companies use to track a specific metric over time. Applicable to all types of project management, the purpose of a construction s-curve is to make sure that the project is tracking according to what was planned, so that it finishes on time and on budget.
The reason for an S-curve being called an 'S-curve' is because the shape/line of the graph typically resembles an S shape when plotted. This is because projects are 'slow to start', ramps up with all types of activity during the middle part of project delivery, and slows towards the end as companies are tying up loose ends and closing things like defects out.
Where construction s-curves differ to some other project management s-curves is that the s-curve resources are more tangible than in many other industries. The 'slow' start of the project might be man hours slowly ramping up as the site is not completed ready yet, more and more materials will be delivered during the body of the project as the entire site or building is under construction, and things tail off at the end when finishing touches are being applied and when the design and project management moves towards the next project - where the whole cycle repeats itself.
How is an S-curve used in construction?
Construction s-curves can be used for a multitude of things, as they are essentially just tracking 'progress'. Some of the main use cases for construction s-curves include:
- Project progress against the planned schedule
- Actual costs against budgeted costs
- Costs against progress as a measure productivity
- Any type of production activity such as the amount of road paved, concrete delivered, floors added etc.
Construction companies could even use s-curves to plot activities like the amount of permits created or inspection conducted to better understand resource allocation.
Most of the time, the most useful 'area' for construction s-curves is in measuring production activities, because this is where the rubber hits the road for construction companies in terms of delivering the work they had planned to deliver.
The phases of the construction s-curve
In the same way that construction projects have different phases, so does the work behind and the use of the project s-curve.
Before an s-curve can be created, a project manager (or similar) will create the project schedule and a detailed timeline of project activities.
After doing this, management can calculate the specific production rates and work which needs to be done based on this schedule i.e what needs to be done every day to deliver the project or asset.
The outcome of this might show that 'work rates' need to be:
- 1000 hours in weeks 1-4
- 1500 hours in weeks 4-12 (plotted cumulatively as 1000 hours + 1500 hours)
- 800 hours in weeks 12-15 (plotted cumulatively as 1000 hours + 1500 hours + 800 hours)
From here, the manager can plot these data points on the graph and get the resulting s-curve.
This is obviously still a planned construction s-curve; and once the project begins, the company and/or project manager can begin to plot the actual data being collected from site - which you want to reflect the planned quantities and production as closely as possible.
How do people manage and update S-curves during construction projects?
The above section described how a project manager or company prepares their initial s-curve, schedule and essentially their 'forecast'.
This is the easy part for most companies.
The tricky part is of course delivering the project, where there are many variables and potential obstacles which become hurdles for sticking to and keeping up with the s-curve.
The other difficulty which arises, specifically on construction s-curves, is simply updating and maintaining the s-curve with the most recent data.
Unlike some other industries and types of work where the project is conducted and tracked in the same place, construction projects face more communication and data portability issues because they have an on-site component and an -in-the-office component.
As an example, the daily progress report report below is a pretty standard progress tracking report. The report documents the % of a specific job completed, as well as some specific production quantities including labour and plant.
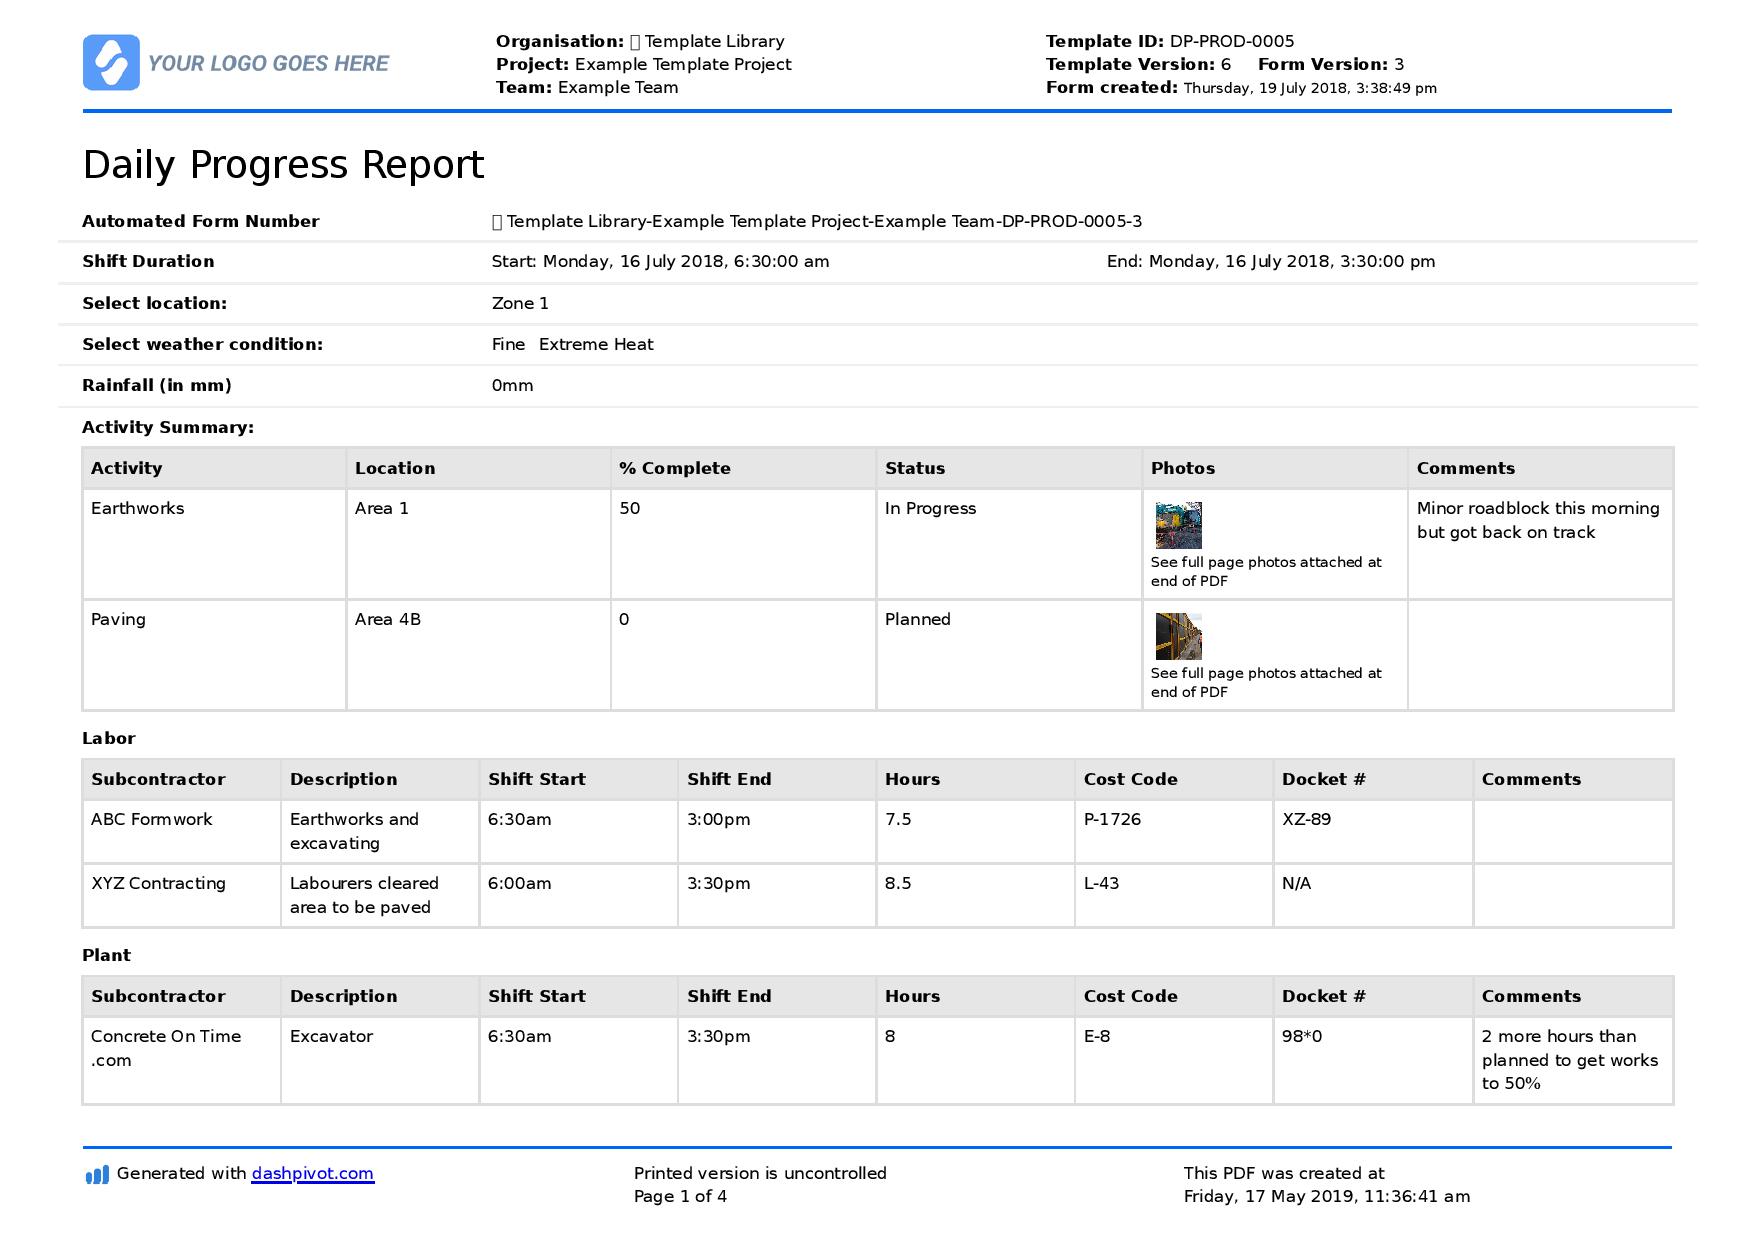


For the companies who manage and fill out their daily reports in this way, the problems start here. All of the information captured with paper-based forms, PDFs and spreadsheets then needs to be scanned, emailed or sent via email. Once 'shared' with an administrator or filled in back at the office, the data then needs to be reconciled into a construction s-curve tracking spreadsheet which can then be displayed in a graph.
In managing the process this way, companies introduce a number of unwanted issues:
- People can forget to upload documents or lose the data completely
- The data is often uploaded or reconciled late
- The information coming in from the field is unstandardised and in different formats (different word docs etc.)
Unfortunately, these issues make a project s-curve much weaker, in that it is delayed, less accurate and less reliable.
The most efficient way to manage an S-curve
Fortunately, today, there is a number of ways (all grounded in new technology) which facilitate the accurate and efficient transfer of data from site into s-curves.
One of the ways is through an integrated management system like this.
With these systems, process like daily reporting are digitised through daily reporting apps and software tools.
Instead of documenting daily progress on a piece of paper or PDF, workers on site update daily progress by simply updating numbers on a mobile or tablet.
These updates are then automatically synced to the information management system - and updated straight into your construction project s-curves.
This removes a number of friction points in the 'old' process, and gives project managers and other personnel real-time insights into progress so that they can make course-corrections and better decisions right now.

See how you can track projects in real-time with digital templates.
The future of the construction s-curve
As you can see from the above s-curve example, the way in which companies can manage s-curves today is far more efficient and helpful than it has been in the past.
But this is only the tip of the s-curve iceberg.
In some industries, project management tracking is almost fully automated. But these industries are mostly digital, so all of the data being produced can be instantly piped through into dashboards and charts.
While s-curve and planned vs. actuals software is a dramatic improvement for construction companies, it does still involve manually inputting data through mobile phones and apps.
In the not very distant future, the data capture as well as the movement if information will be automated.
Manhours will be calculated by workers simply moving on and off site, plant and equipment will talk to softwares and update their running hours, and sensors and other technologies will track productions rates, weights, distances and more.
This is an exciting future, where project managers and workers can spend their time adding value and making smart project management decisions - rather than doing admin and moving information from one place to another.
The future of project management and construction s-curves is bright, and there are some really powerful tools and ways in which companies can improve their s-curves today.
Delivering on time and on budget is never easy, and there are countless possible delays and scenarios in construction which make it even more difficult. But being able to see how you and your project is tracking in real-time on a reliable s-curve, is the most powerful mechanism you have for keeping on track every step of the way.


See how you can easily streamline your systems and processes with Sitemate today
