Safety – Severity rate

Severity rate definition, formula, calculation and more
Severity rate definition
Severity rate is a safety metric which companies and projects use to measure how critical or serious the injuries and illnesses sustained in a period of time were by using the number of lost days (on average) per accident as a proxy for severity.
Calculating and understanding the severity rate of injuries in your workplace supplements the other standard safety KPIs which track the frequency of incidents and accidents by giving companies and managers a better idea as to how bad the accidents on their jobs are, which areas of the business experience more serious injuries, and what could be done in terms of accident response and other processes to reduce the severity of incidents.
Severity rate formula
The severity rate formula is one of the most basic formulas. Similarly to many other safety measurements, the severity rate formula is designed to gauge safety performance on an equal footing for all types and sizes of companies by standardising the measurement based on 100 full-time workers working 200 hours per year (50 weeks x 40 hours).
The actual severity rate formula can be seen below:

As an example of what this severity rate formula looks like in practice, imagine that a construction company reported 25 lost work days due to accidents in 2018, and they had 2,000,000 total work hours on their jobs.
The severity rate calculation from here would be:
Severity rate = (25 lost work days x 200,000) / 2,000,000 hours worked = 1 lost day per accident
The severity rate for this company would equal 1 days per incident - so on average, each incident results in one day off work.
As you can see from the above formula and calculation, a low severity rate would indicate that the accidents which did occur on site were not severe in that no one had to take time off work because of the incident - while a high severity rate would show that there was at least one and potentially more than one serious injury or illness.
The strengths and weaknesses of severity rate
As you may have already realised from the above severity rate calculation and formula, there are some obvious and unfortunate weakness in the severity rate.
The main weakness is that the final severity rate number derived from the calculation is an average. This means that the final result can be skewed dramatically by one serious incident.
While the seriousness of this incident might warrant a much higher severity rate overall, it could also exaggerate one issue or mishap in an unfair way. In the same way, a much lower severity rate in one year could also hide certain issues by not including one of those big incidents which results in a number of days lost.
Even thought there are some mathematical weakness in the severity rate, there are some strengths of the measure which make it important and powerful.
As previously mentioned, common KPI's like lost time injury frequency rate and the total recordable incident rate do a great job of quantifying how often incidents and accidents occur, but they don't do great job with clarifying how severe these incidents were.
The severity rate really helps here, alongside DART safety and a few other metrics.
Another reason that severity rate is important is because the most disruptive incidents are those which are most severe. The accidents which cause days or weeks off of work cause a lot of disruption in that replacement people need to be sorted, medical bills need to paid, and production and productivity is effected.
High severity rates are worrying to workers, damaging to productivity and a major red flag for agencies and authorities charged with keeping people safe at work - and who look at and benchmark these measurements across entire industries.
There is a reason that most safety teams and companies have a number of safety metrics which they monitor to get a comprehensive view of their safety performance - and the severity rate is a key part of this arsenal.
Tracking and measuring severity rate in your workplace or on your projects
Severity rate is actually much easier to manage than many other safety scores, because the only data points you need to calculate it effectively are the days lost (which should be kept for accounting and safety purposes) as well as the total number of hours worked.
Because it is relatively easy to find and calculate your severity rate numbers, it is easy to keep your calculation on a simple spreadsheet or on a piece of paper.
But good safety teams and companies managing safety efficiently today are also organising their information efficiently, so that they have all of that good data at their fingertips.
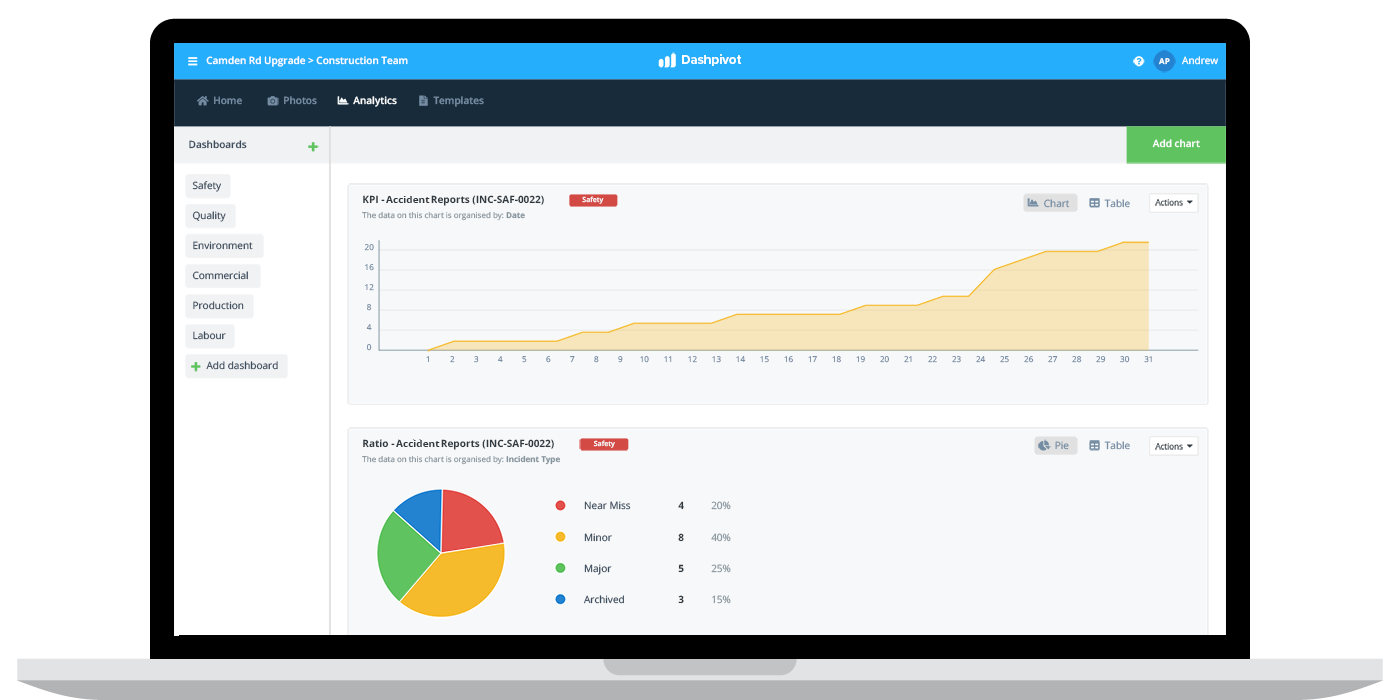
For most companies, this involves setting up safety dashboards which are segmented into specific functions, KPI's or areas of the business.
Organising your information in this way enables you to get better and quicker insights. Data from site can be more quickly piped and reconciled into the safety management system, and project managers and other responsible people can manage these insights and make more informed decisions about where improvements can be made and where the severity rate - along with other key metrics - can be improved.

People in 80+ countries use this safety management system to document, track and improve severity rates.

See how you can easily streamline your systems and processes with Sitemate today
